


Netflix’s 2019 show “Tidying Up with Marie Kondo” ignited a decluttering movement, inspiring viewers to adopt Kondo’s Japanese-inspired method for organizing their homes. The results are remarkable, with enthusiasts experiencing more serene living spaces and enhanced relationships with their partners. Central to this approach is the guiding principle of retaining only items that genuinely “spark joy.”
The same thought process can be applied to enterprise data visualization.
Product leaders would relate to this as they’re always navigating a sea of data, trying to make sense of it all. They’re trying to slice, dice, and transform overwhelming arrays of numbers into clear, navigable star maps…
The challenge lies not only in deciding what data is relevant but also in how to present it in a way that is both meaningful and accessible to everyone. This is no small feat, especially considering the impact on employee experience. 84% of respondents in a Deloitte survey highlight employee experience as a top challenge, and only 9% feel equipped to tackle it.
As Edward Tufte says:
Clutter and confusion in data are not inherent but are often the byproducts of poor design.
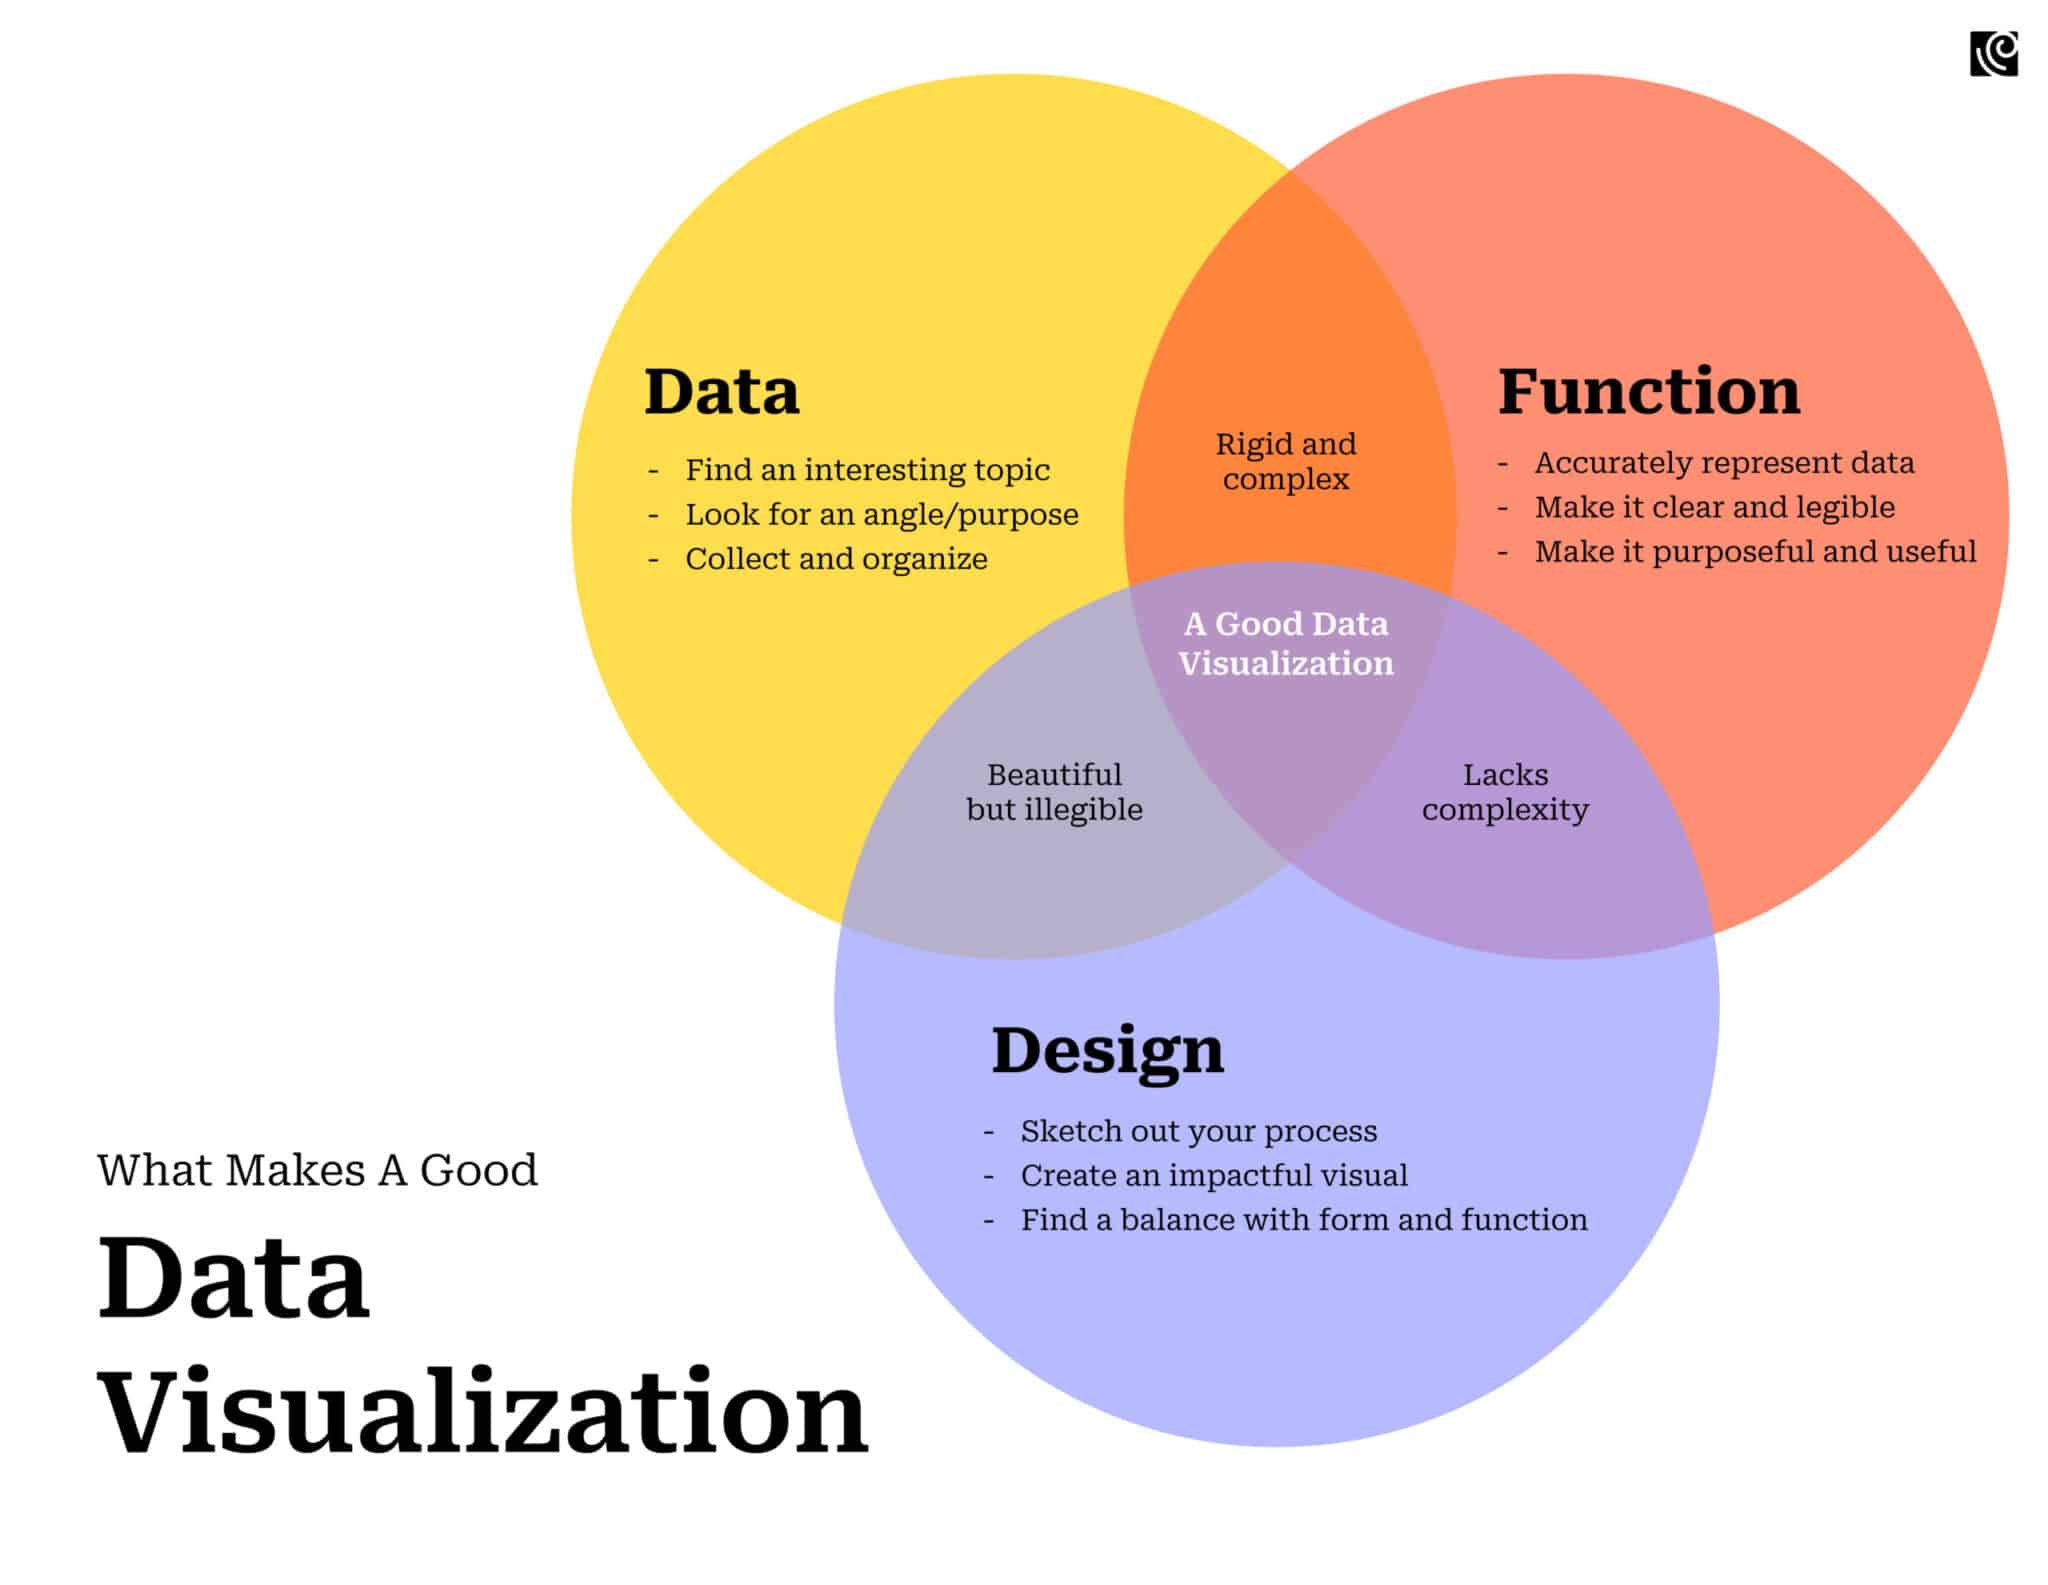
The essence, therefore, lies in the design itself. Effective enterprise data visualization transcends mere representation. It combines aesthetic appeal with clarity and accuracy.
This article dives into how product teams can leverage data visualization best practices to transform complex data into clear, impactful visual stories, enhancing decision-making in the enterprise setting.
Importance of Data Visualization For Enterprise Businesses
IBM’s research highlights the creation of 2.5 quintillion bytes of data every day, a testament to our rapidly digitizing world.
Andrew McAfee and Erik Brynjolfsson underscore this explosion, noting that data transfer across the internet now surpasses the entire internet’s storage capacity from two decades ago.
This deluge of data is only expected to grow, with IDC projecting a leap to 175 zettabytes by 2025.
Amidst this overwhelming influx of information, the importance of efficiently managing and interpreting this data becomes paramount for businesses to stay competitive and informed.
The Human Brain and Data Comprehension
The human brain, despite its complexity, faces limitations in processing large numbers. This is where the significance of data visualization in enterprise settings becomes evident.
Data visualization acts as a bridge, translating vast and complex datasets into visual formats that are far more digestible.
By creating graphical abstractions, data visualization makes intricate data sets accessible, enhancing their utility across various sectors like economics, science, technology, healthcare, and human services. In essence, data visualization is about transforming information into a narrative that informs and guides decision-making processes within enterprises.
Top Challenges of Data Visualization
Balancing Simplification with Information Integrity
“No matter how clever the choice of the information, and no matter how technologically impressive the encoding, a visualization fails if the decoding fails.”
William Cleveland, author of Visualizing Data
One of the foremost challenges in data visualization is maintaining the integrity of information while simplifying it for better understanding. This process often involves condensing data into aggregates or summaries, which, while making it more digestible, can strip away critical nuances.
Overly simplified visualizations risk overlooking essential subtleties, potentially leading to misinformed decisions. Conversely, visualizations that retain too much detail can overwhelm the viewer, causing confusion or analysis paralysis.
Integrating with Diverse Data Sources
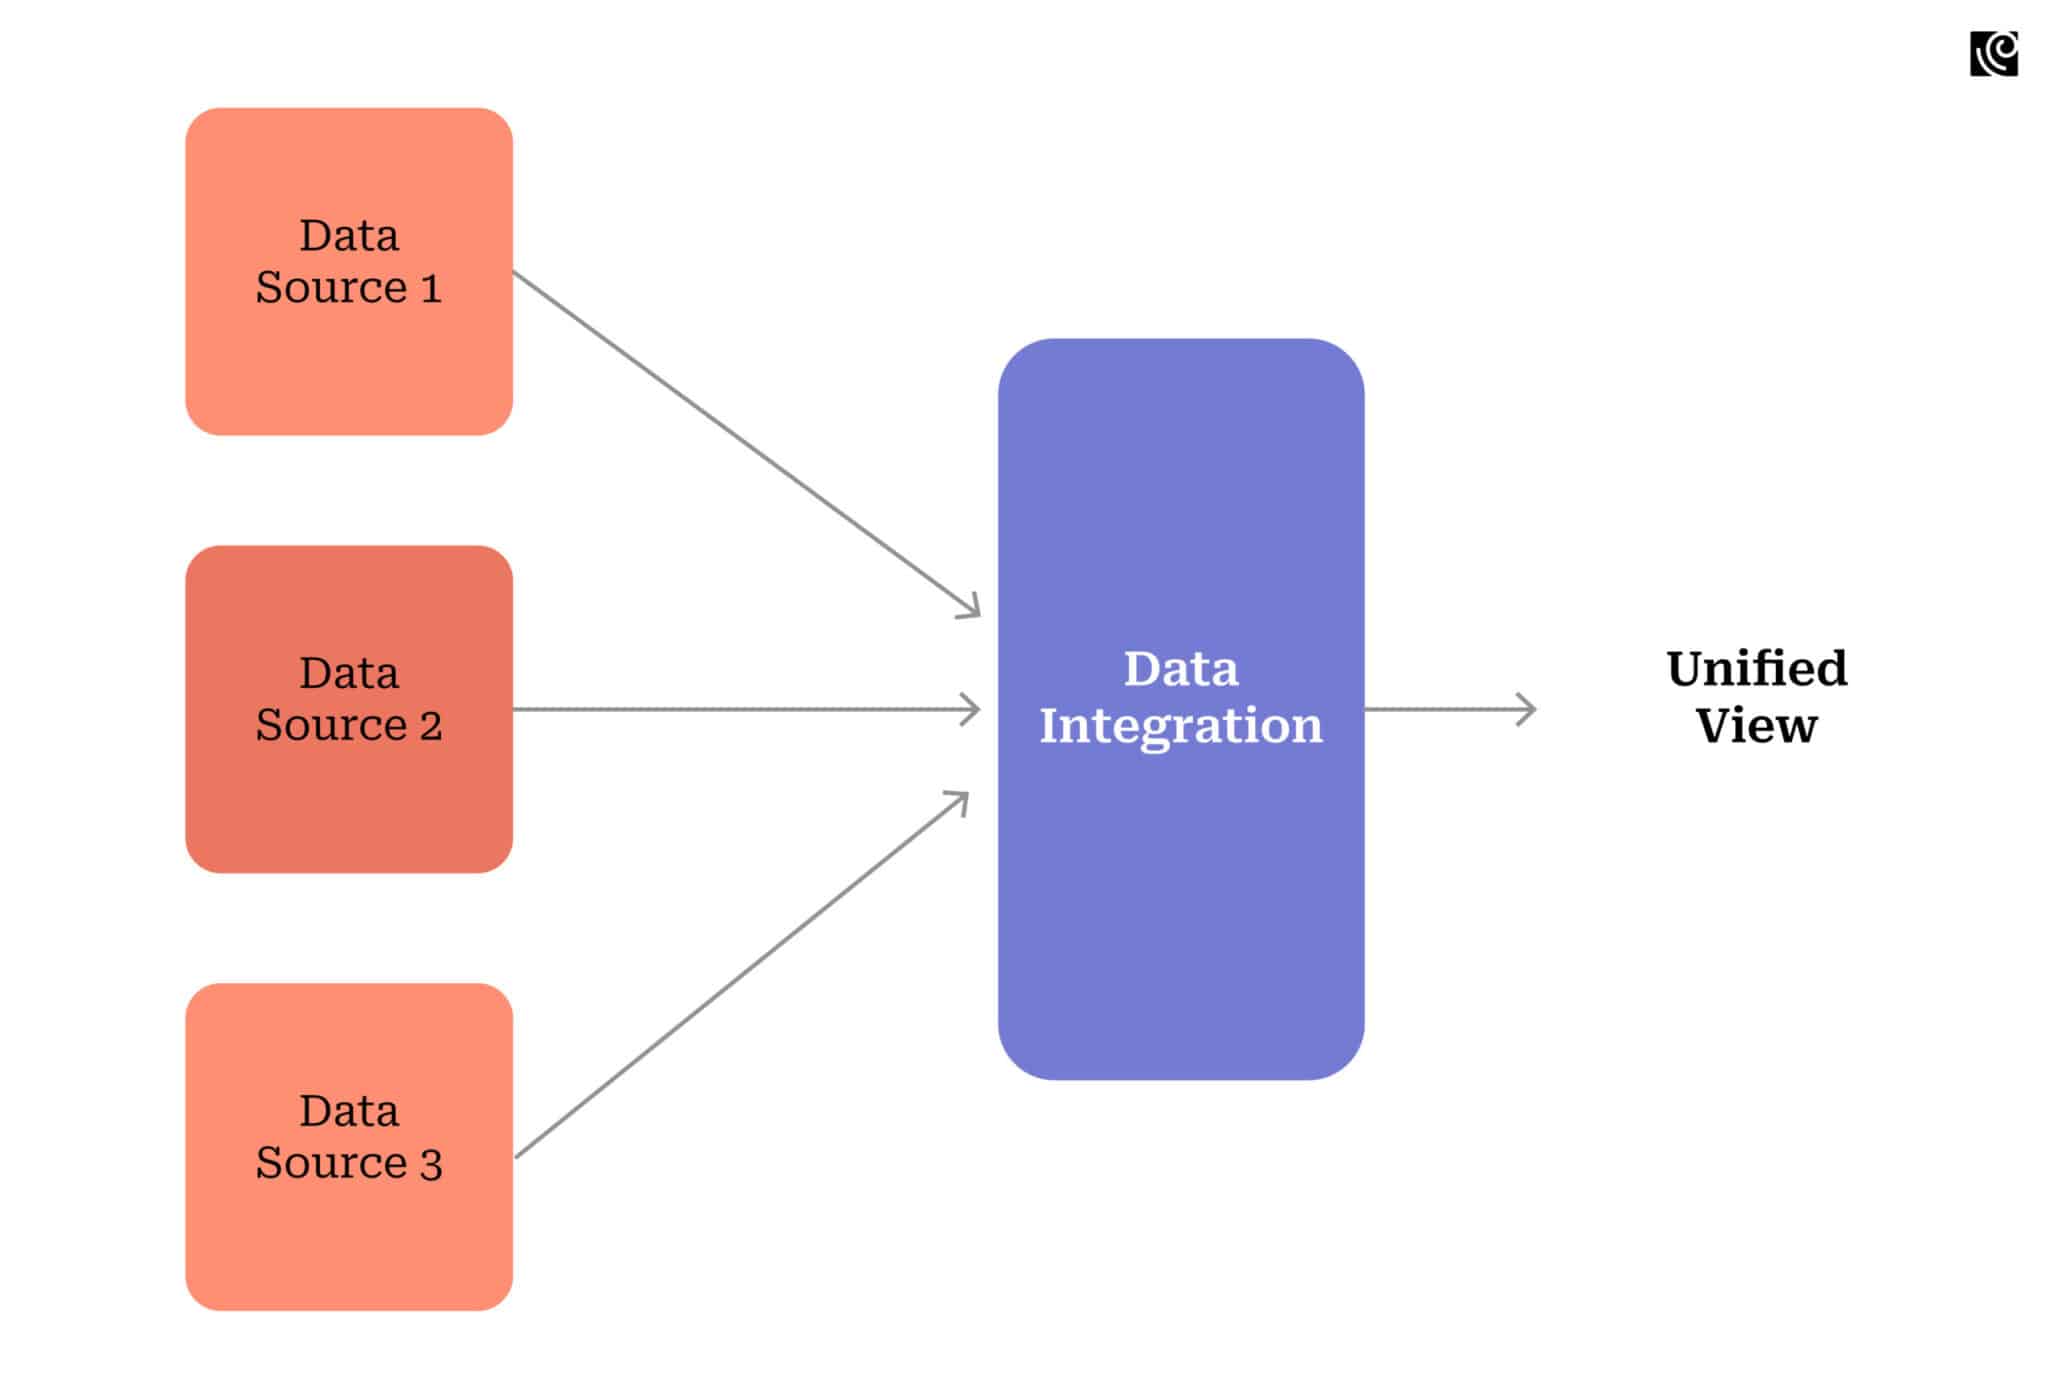
Dealing with the plethora of data sources is one of the most daunting challenges of enterprise data visualization. Enterprises often find their data scattered across different systems such as Customer Relationship Management (CRM) systems, Enterprise Resource Planning (ERP) software, and various custom databases. The challenge lies in creating a unified visualization platform that can seamlessly aggregate and interpret data from these varied sources.
Avoiding a Cluttered Interface
The challenge of presenting complex data without creating a cluttered interface is paramount. A cluttered interface, crammed with excessive visuals or complex navigation, can lead to user frustration and decreased productivity. More critically, it risks obscuring essential insights that data visualization is meant to reveal.
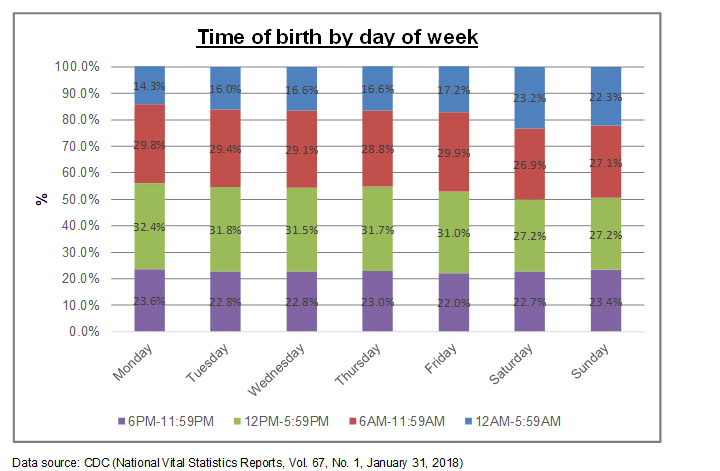
Check this graph for instance. It shows the percentage of babies born within 24 hours, broken down by day of the week. This is what happens when you put your data into Excel and create a stacked bar chart with default settings.
Now look at a de-cluttered version of this after a few design modifications, like removing unnecessary borders and gridlines, minimizing distraction, appropriate data labeling, thicker bars, and using colors strategically to direct focus.
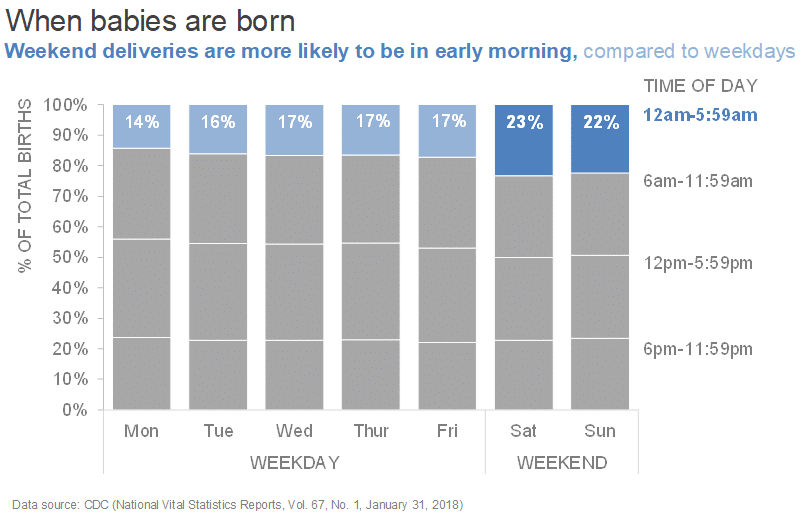
It’s clean and simple and employs techniques that highlight key data points without overwhelming the user. This balance is crucial in interactive data visualization, where user engagement is directly linked to interface usability.
Catering to Diverse User Backgrounds
Enterprise users range from those with minimal technical knowledge to expert analysts, each requiring different levels of complexity in their data visualization tools.
Striking a balance is key – interfaces must be intuitive for non-technical users to gain insights without feeling overwhelmed, while also catering to the depth and functionality needed by power users. Consider a telehealth system:
- Patients: The challenge here lies in distilling complex medical information into understandable insights without using intimidating medical terminology or presenting data that could be misinterpreted without proper medical guidance.
- Administrators: Administrators need to digest a vast array of operational data. The challenge is in presenting this multifaceted data in a way that doesn’t overwhelm the user but still offers the comprehensive insights needed for effective management.
- Medical Staff: For medical staff, the challenge is to design an interface that allows for quick, intuitive access to a high volume of patient data and the ability to perform detailed analyses without cluttering the visual space. This is further complicated by the need for interoperability with other medical systems and databases, ensuring that the data visualization tools enhance, rather than hinder, the medical staff’s workflow.
Best Practices for Effective Enterprise Data Visualization
“Information is only as valuable as its presentation allows it to be.”
The true power of data lies in how effectively it is communicated, transforming raw numbers into meaningful insights. Let’s find out the best practices that are fundamental for achieving effective enterprise data visualization.
Choosing the Right Visualization Type
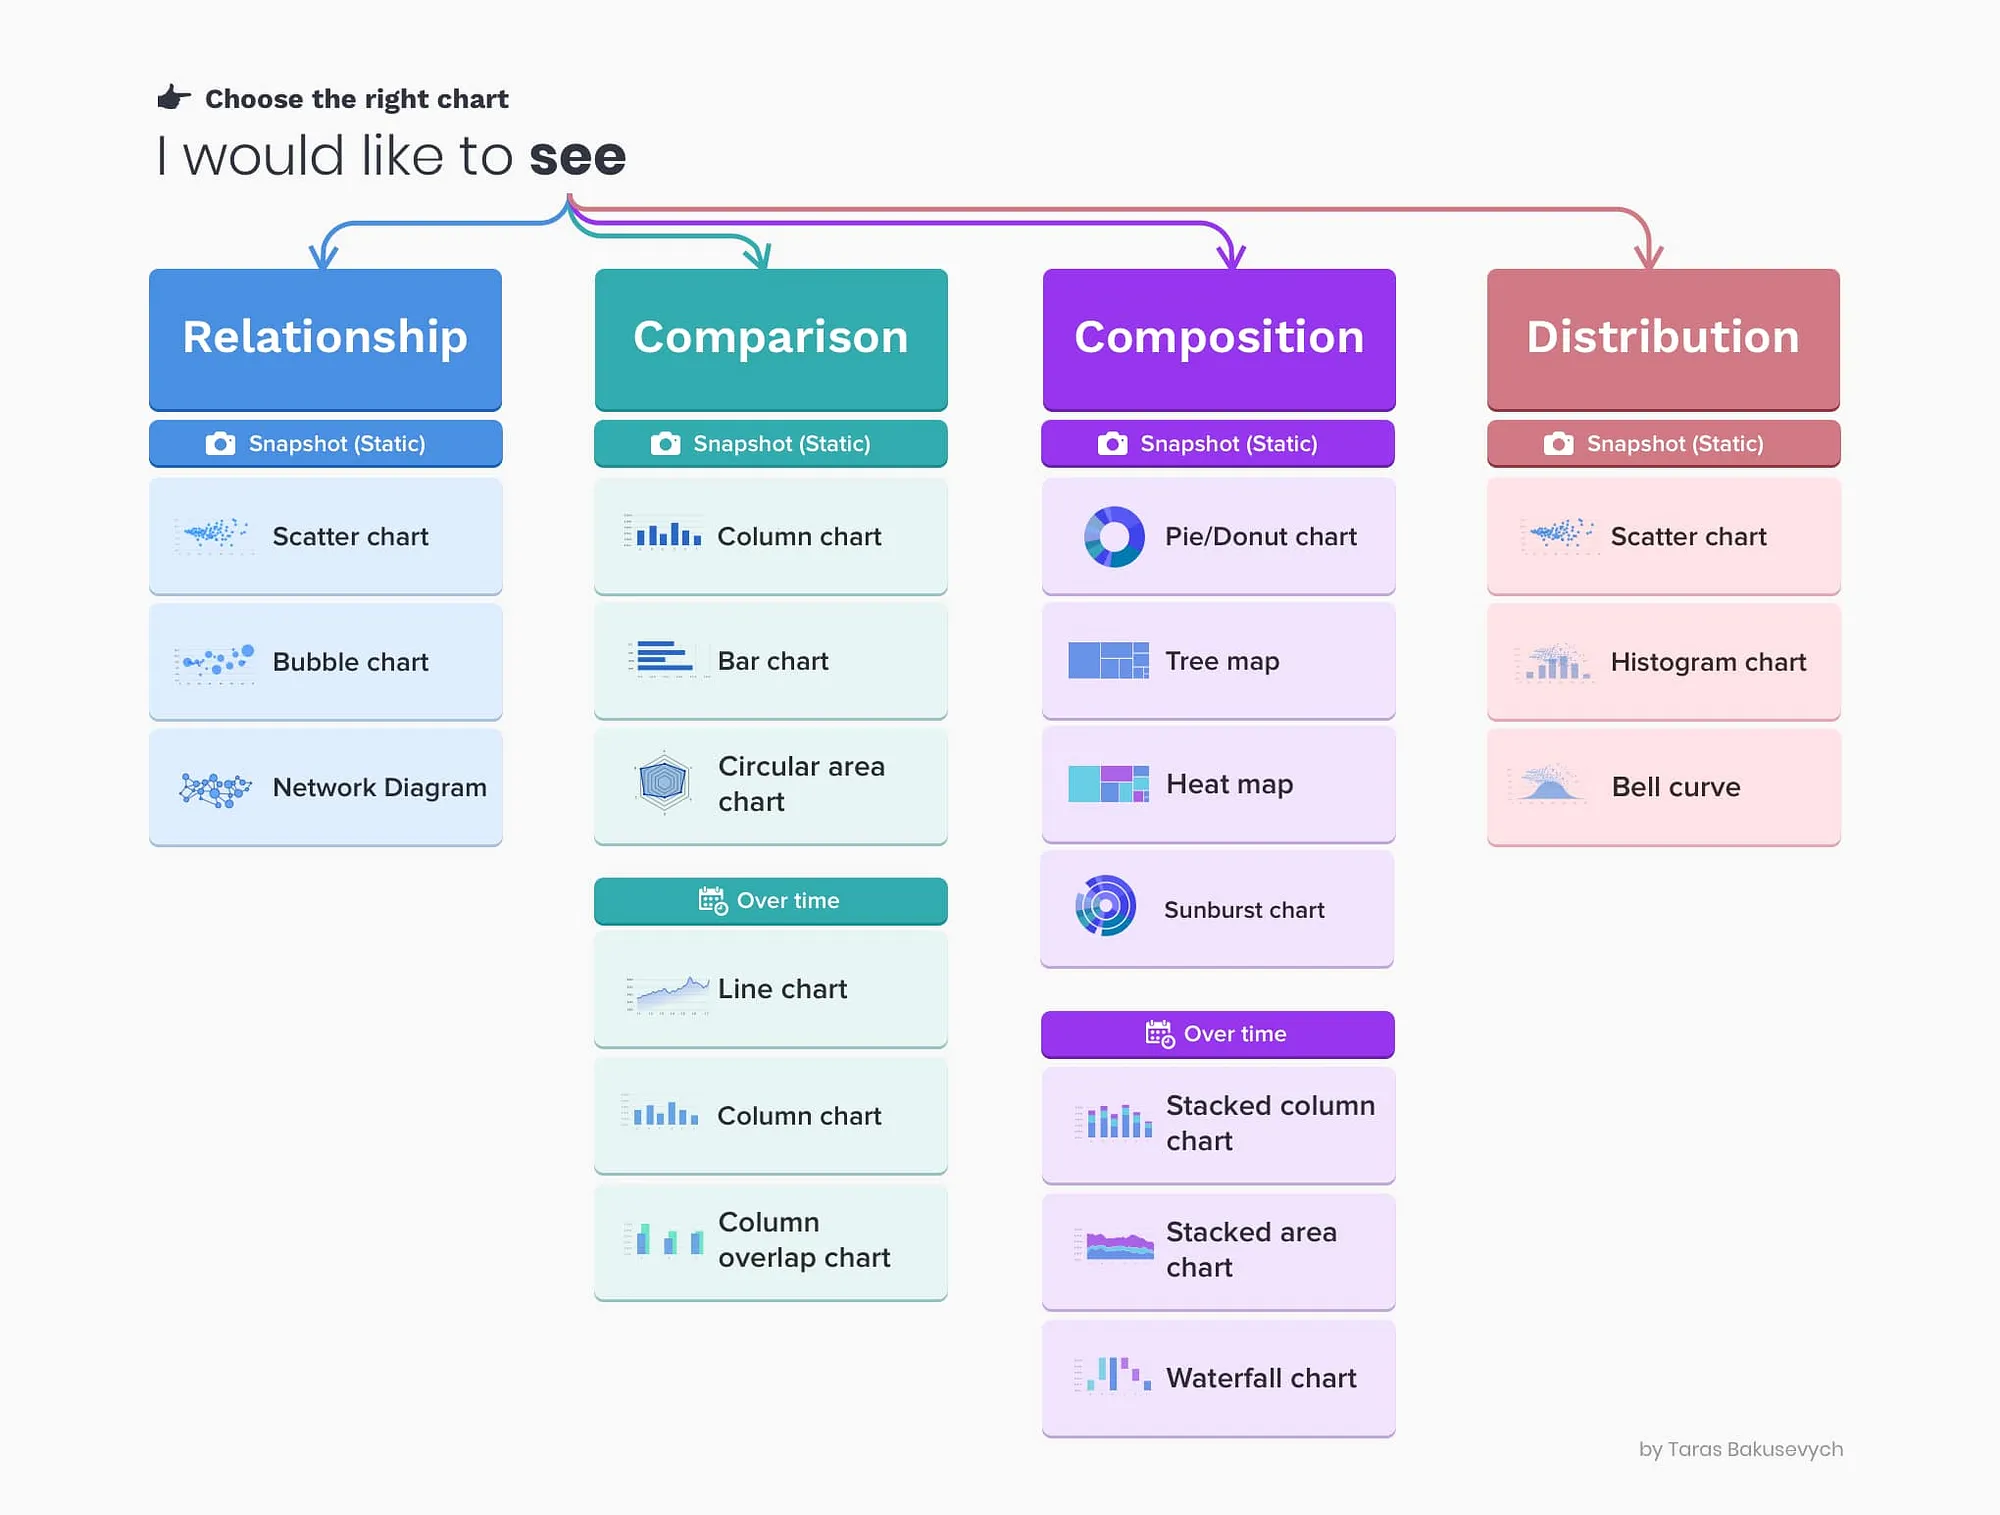
One fundamental best practice in enterprise data visualization is selecting the right type of visualization for the data at hand. Each data type and objective necessitates a specific visualization approach.
- For instance, time-series data is often best represented by line graphs, which can clearly depict trends over time.
- Conversely, categorical data, such as sales performance across different regions, maybe more effectively conveyed through bar charts.
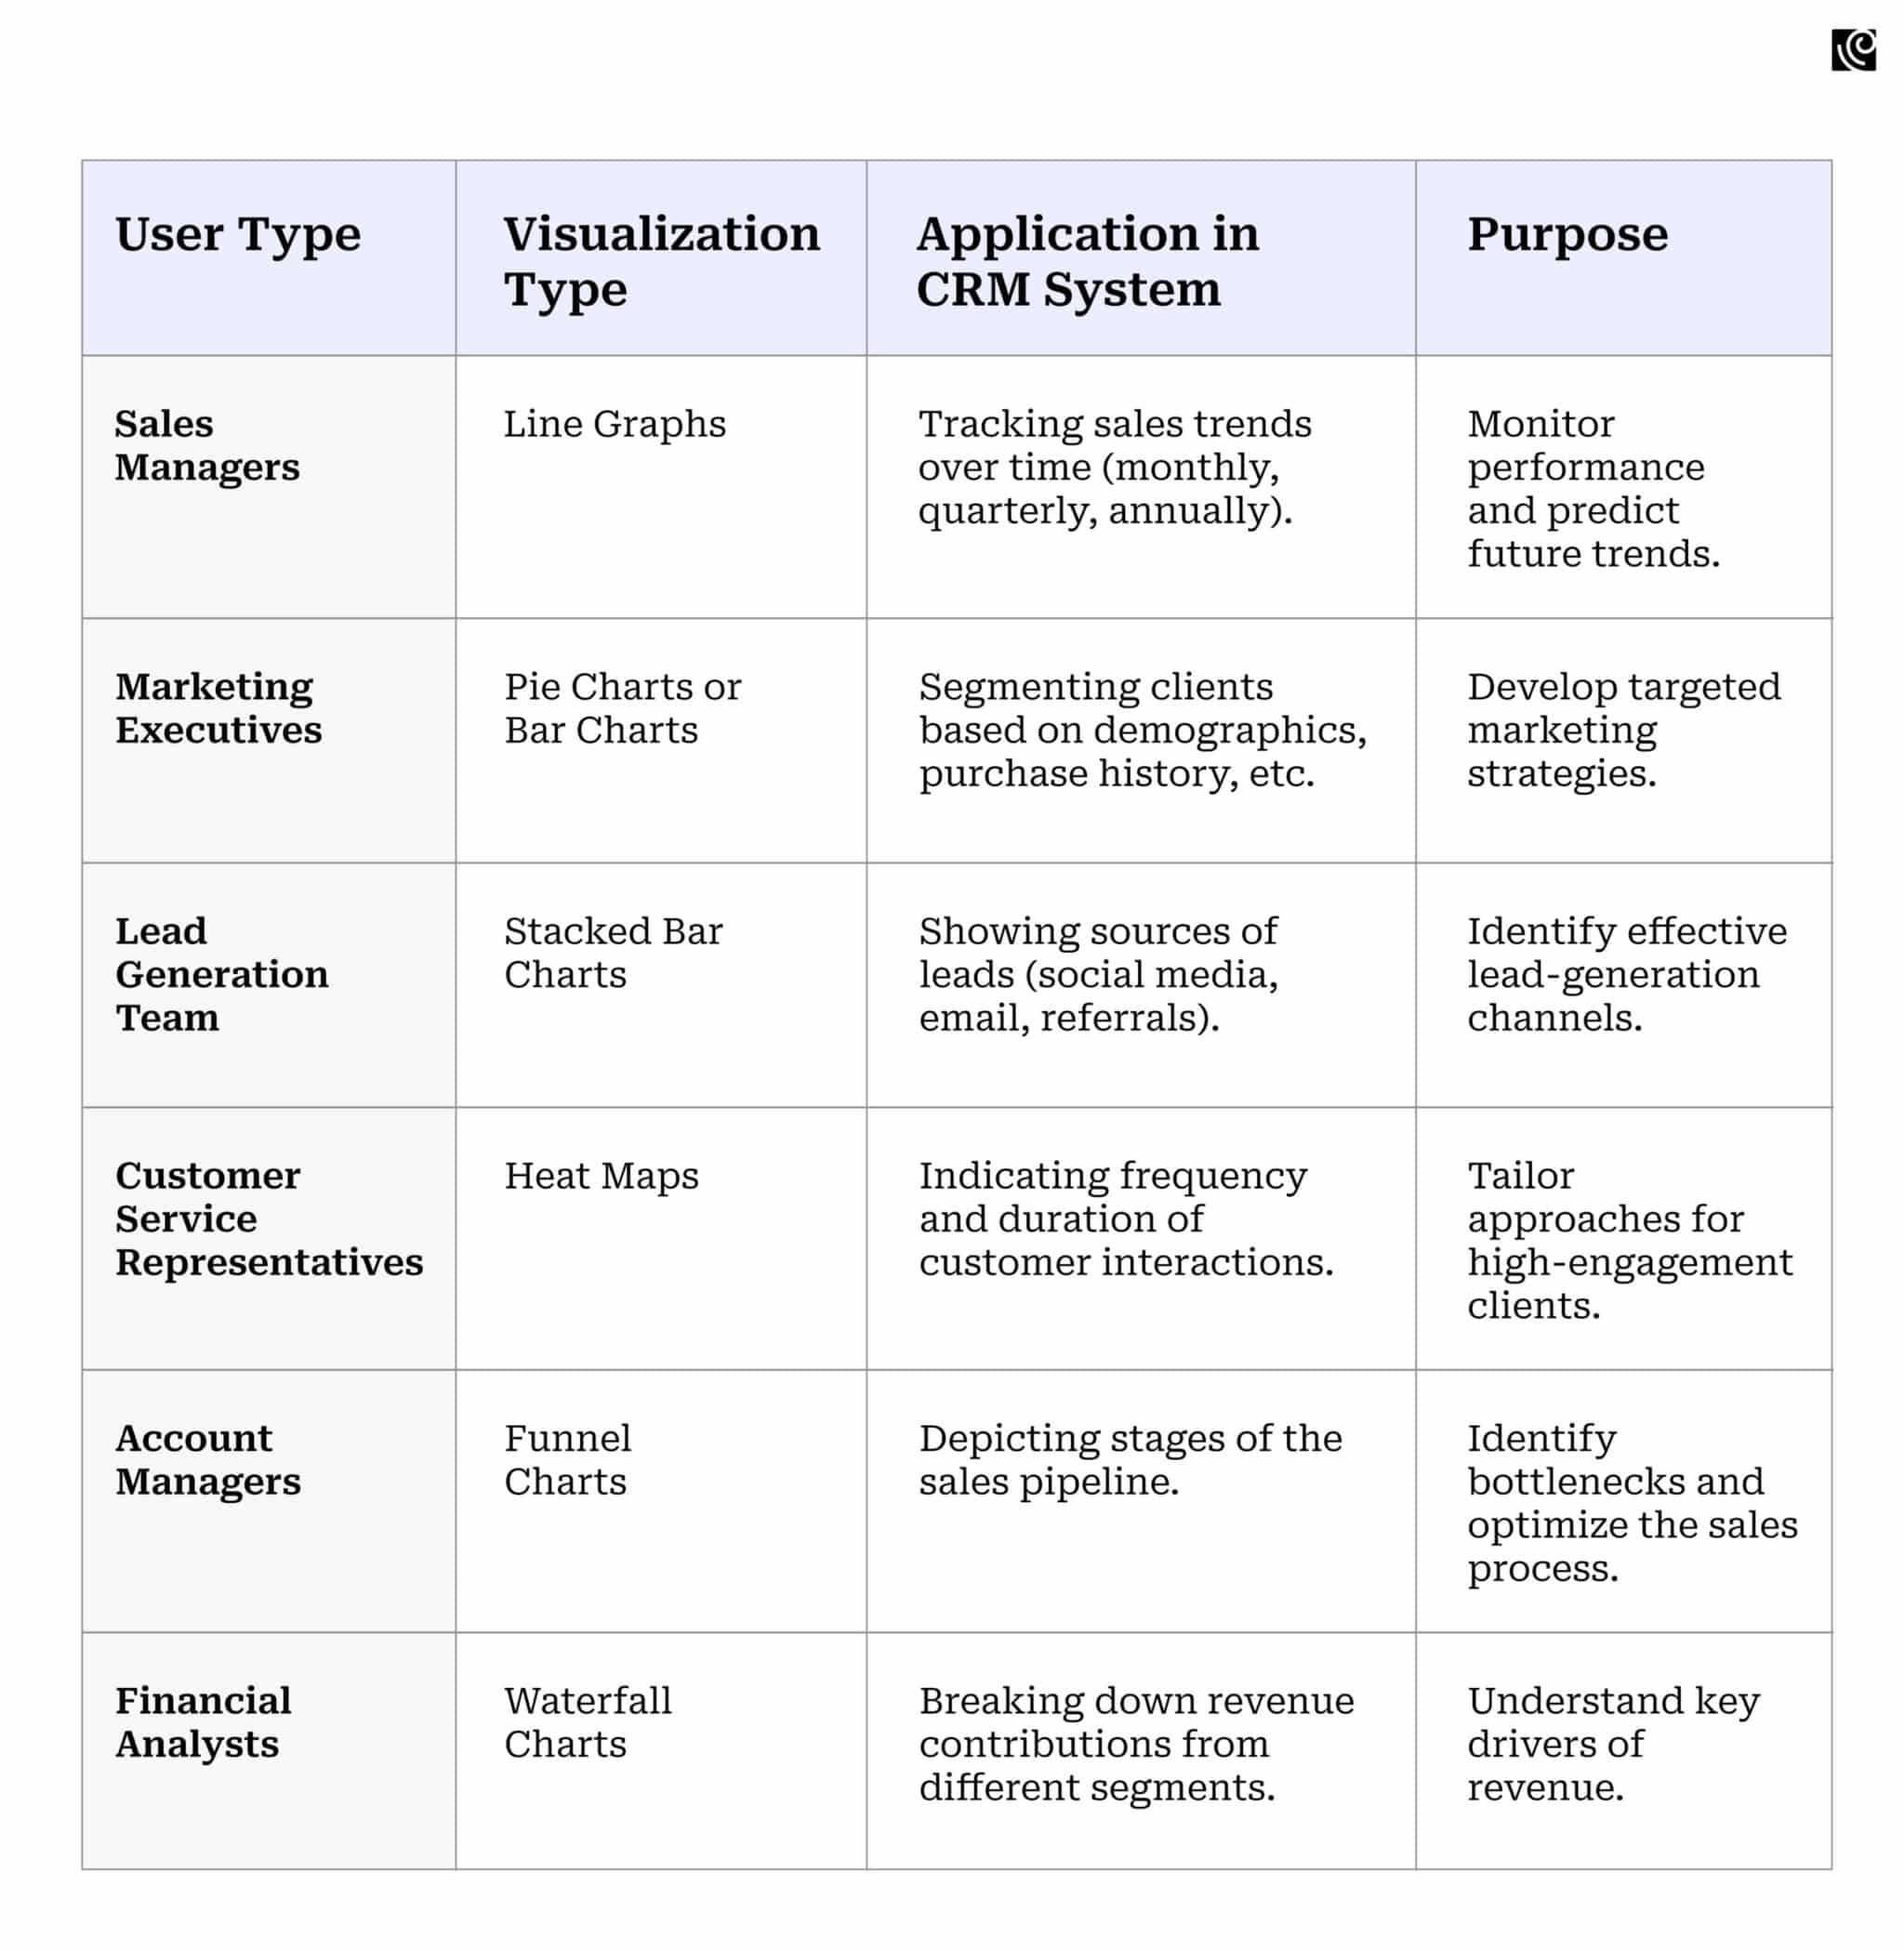
In enterprise settings, where decisions are backed by data, the clarity provided by the appropriate visualization can be the difference between insight and oversight. For example, consider a CRM system. Here’s how you can use different types of data visualizations for various user types.
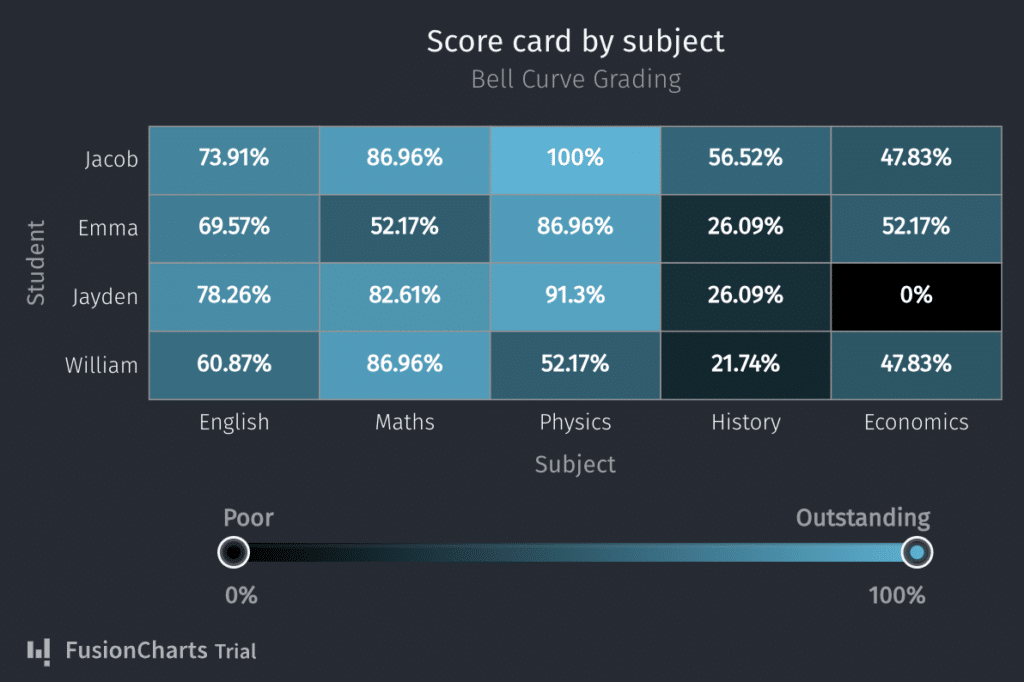
Utilize Heat Maps and Tree Maps
A heat map is a two-dimensional representation of information with the help of colors. They excel in revealing patterns and trends within datasets, making them ideal for visualizing the density or frequency of events. For instance, a heat map in a sales dashboard can swiftly convey regions with the highest sales activity, allowing businesses to target their strategies effectively.
Best Practices for Designing Heat Maps
- Balanced Data Ranges: Use numerical ranges that ensure a uniform distribution of data, enabling a clear and fair representation across the heat map.
- Color Selection: Opt for a consistent color palette, using shades of a single color or a gradient between two analogous colors to represent data intensity. This approach avoids placing undue emphasis on certain data points due to color bias.
- Color Intensity for Emphasis: Utilize varying intensities of the chosen color(s) to indicate the strength or concentration of data, ensuring that higher intensities correspond to higher data values.
- Clear Legends: Include a well-defined legend that clearly explains the color coding, making it easy for users to interpret the data accurately.
- Consistent Scales: Use consistent scales and intervals to maintain accuracy and facilitate comparison when using multiple heat maps for related data sets.
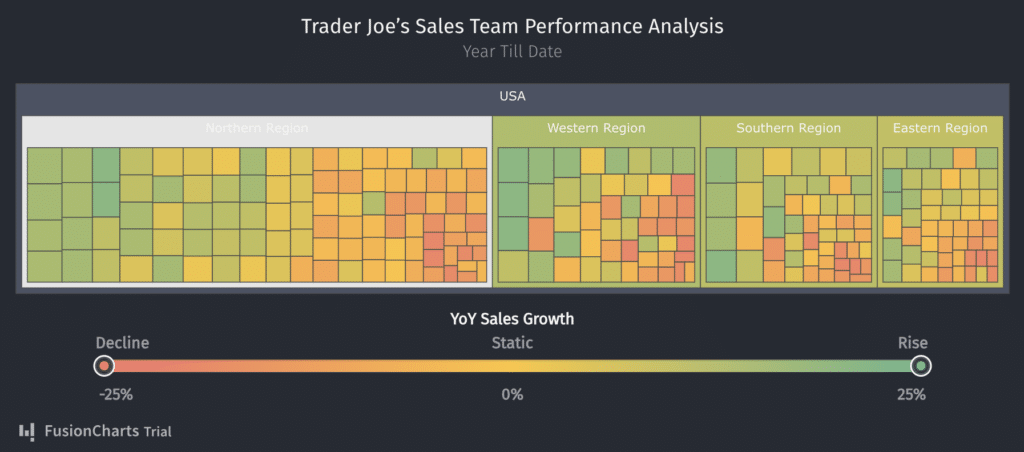
Treemaps are ideal for displaying large amounts of hierarchically structured (tree-structured) data. They are particularly adept at illustrating hierarchical data and showing how individual segments contribute to the whole. They can be used to display product categories in an e-commerce inventory, demonstrating how each category contributes to overall sales.
Best Practices for Designing Tree Maps
- Interactive Data Labels: Hide data labels by default and make them visible upon hovering over a node. This approach reduces clutter and focuses attention on specific data points as needed.
- Enhanced Text Legibility: To ensure readability against a multicolored background, add a subtle glow or shadow around text labels. This technique helps neutralize the contrast and keeps the text legible.
- Balanced Data Ranges: Select numerical ranges that promote an even distribution of data across the tree map. This prevents skewing the visual representation and ensures a fair and accurate portrayal of data.
- Color Strategy: Use a color scheme that is intuitive and reflects the data effectively. Opt for different shades of the same color or analogous colors to represent varying data intensities or categories, avoiding overly bright or conflicting colors that might distort interpretation.
- Consistent Sizing: Ensure that the size of each block within the treemap accurately reflects its data value. Consistent sizing is crucial for maintaining the integrity of the data representation and aiding in comparison across different categories or segments.
Data aggregation and filtering options
Data aggregation and filtering allow users to customize their views, enabling them to aggregate data at varying levels and apply specific filters to concentrate on particular aspects.
This approach not only simplifies the visual complexity but also ensures that crucial information is not lost in the process.
Example: Insurance Claims Management System
In an insurance claims management system, robust data aggregation, and filtering options can greatly enhance the effectiveness of data visualization.
Data Aggregation:
- The system could aggregate claims data at various levels, such as by type of claim (auto, home, health), by geographic region, or by time (monthly, quarterly, annually).
- This allows insurance analysts to observe trends and patterns at a macro level, such as identifying which types of claims are most common in a particular region or during a specific time frame.
Filtering Options:
- Users can apply filters to focus on specific areas, such as claims exceeding a certain value, claims under a specific category, or claims that took longer than average to resolve.
- For instance, a regional manager might filter the data to view only auto insurance claims in their region to analyze the frequency and causes of these claims.
- Claims adjusters could filter by unresolved claims to prioritize their workload.
Embrace minimalism and focus on hierarchical data presentation.
Adopting a minimalistic approach in enterprise data visualization is not just a design choice; it’s a strategic decision. By focusing on presenting key data points with clarity, companies can enhance the effectiveness of their data communication.
Visual hierarchy plays a pivotal role here, guiding the user’s attention seamlessly to crucial information first. This is achieved through thoughtful layout, contrasting colors, and impactful typography.
For instance, companies like Tableau and Microsoft with their Power BI tool exemplify this best practice. See for yourself:
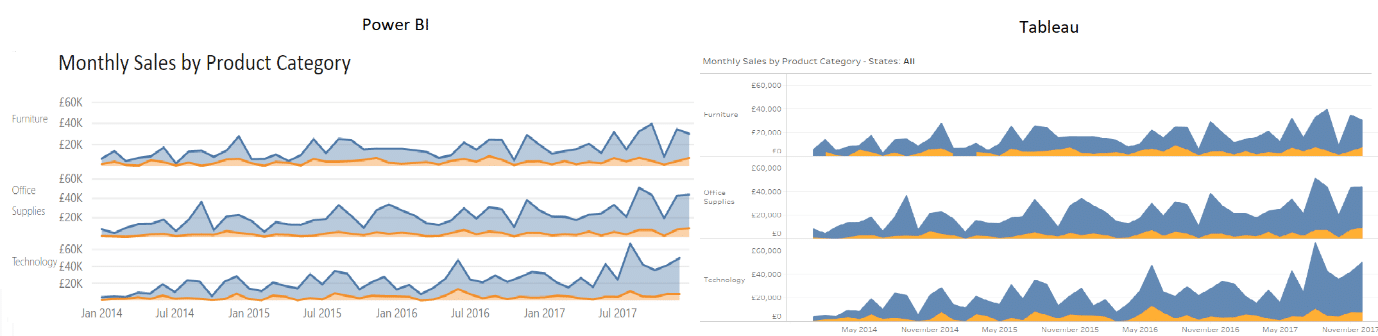
Power BI:
- The Power BI visualization uses a muted color palette with clean lines and an uncluttered background. This minimalist approach directs focus to the trend lines, making the data the central point of attention.
- The hierarchy is clear, with product categories distinctly separated along the vertical axis. This allows for an immediate comparison of trends between categories over time without any distractions.
Tableau:
- Tableau’s visualization also adheres to a minimalist design, using solid blocks of color to represent data, which makes it easy to differentiate between categories at a glance.
- The hierarchy in Tableau’s presentation is maintained by layering the data, with each category’s performance clearly delineated from the others, providing a visual summary of sales trends.
Adaptive UIs in Data Visualization
The adoption of adaptive user interfaces (UIs) has become a cornerstone in data visualization best practices, particularly within the enterprise domain. Their importance stems from the need to cater to a diverse user base, with varying levels of expertise and data interaction requirements.
Adaptive UIs excel by dynamically adjusting the complexity of the user interface to match the technical proficiency and preferences of each user. This flexibility is crucial for enhancing usability and ensuring that the insights offered by data visualizations are accessible to everyone from novices to experts.
Example: Telehealth System
Consider a telehealth system utilized by patients, healthcare providers, and administrators. An adaptive UI for such a system could look like this:
- For Patients: The UI displays basic health indicators, appointment schedules, and medication reminders in a straightforward, easy-to-understand format. A patient can click on a health indicator to get more context or set reminders for medication, making the system interactive and user-friendly.
- For Healthcare Providers: Doctors and nurses would see a more complex UI, with detailed patient health data, trends over time, and alerts for abnormal results. The system could allow for deeper data interaction, such as clicking through to medical histories or lab results.
- For Administrators: The UI might include the ability to view and manage resource allocations, staff schedules, and patient throughput. Administrators could interact with the data to optimize operations, such as reallocating resources in response to real-time demand.
Steer Clear of Misleading Dual-Axis Charts
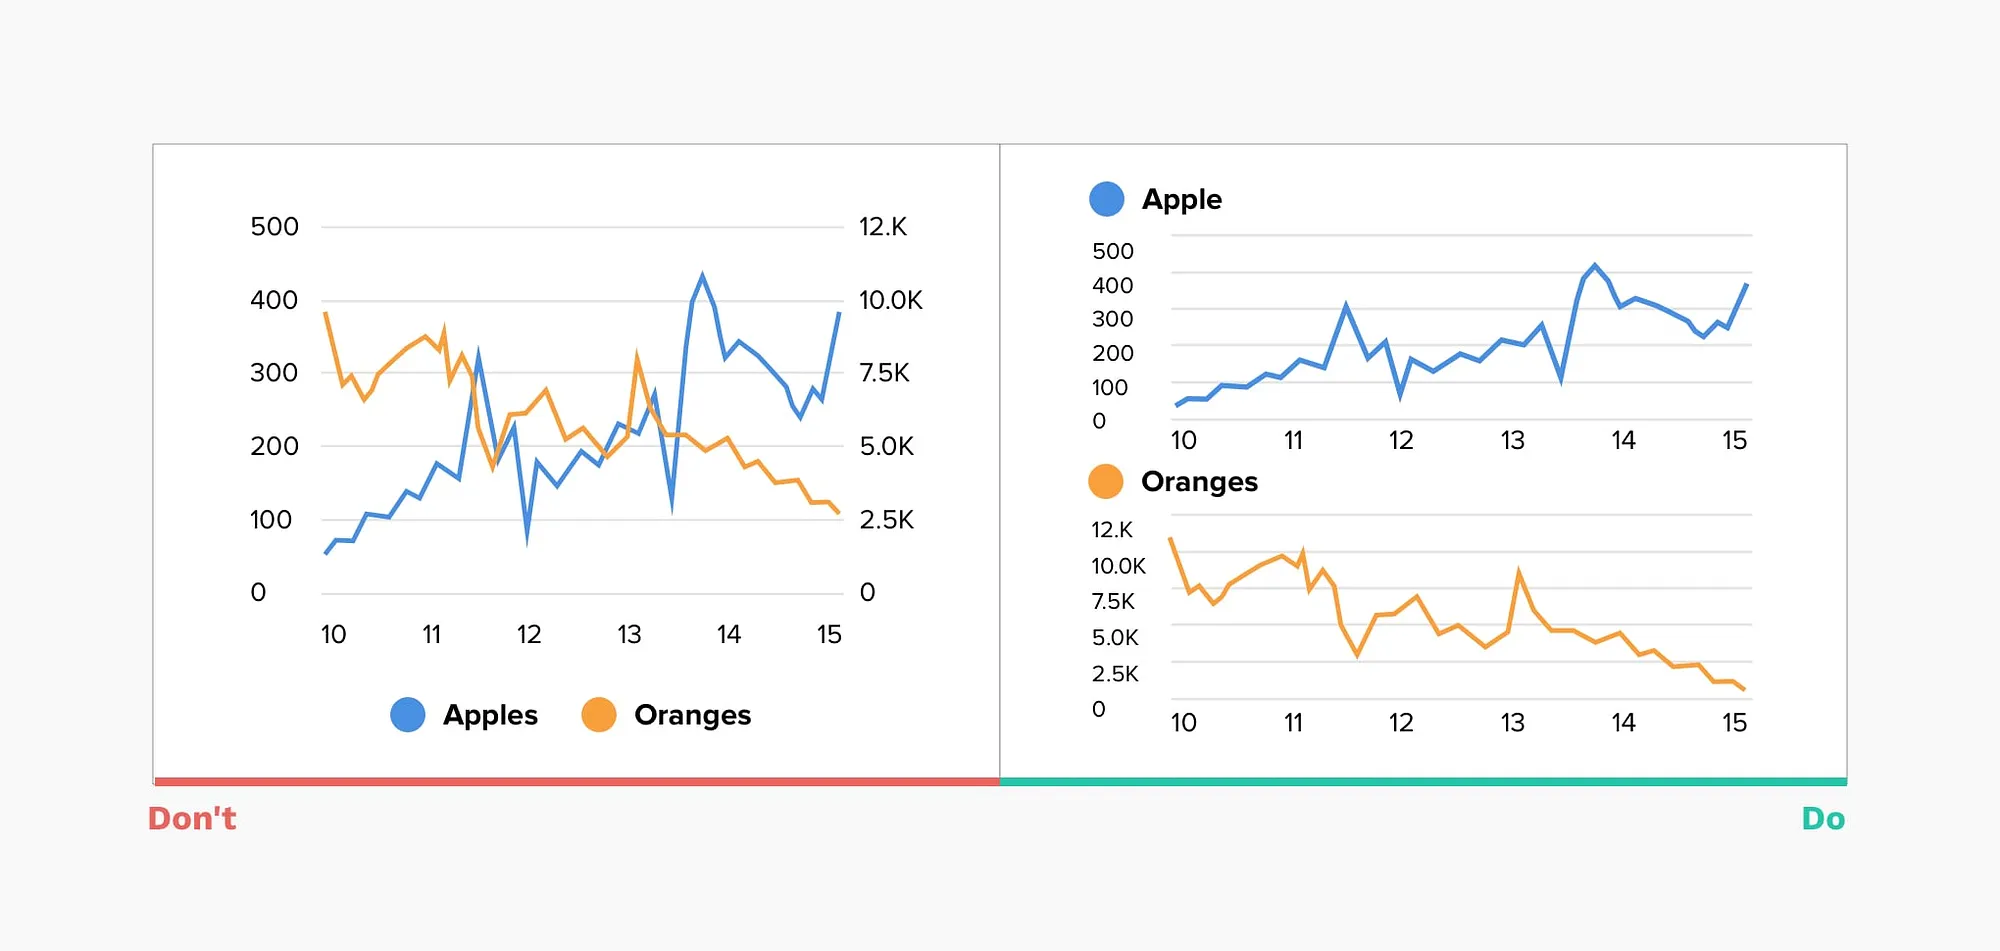
Dual-axis charts may seem like a space-efficient way to compare two data series of similar measures but differing magnitudes. However, these charts can be challenging to interpret and may inadvertently mislead. Often, users overlook the different scales and hastily scan the chart, which can lead to incorrect conclusions. It’s crucial to present data comparisons in a straightforward manner that doesn’t confuse or misguide the audience.
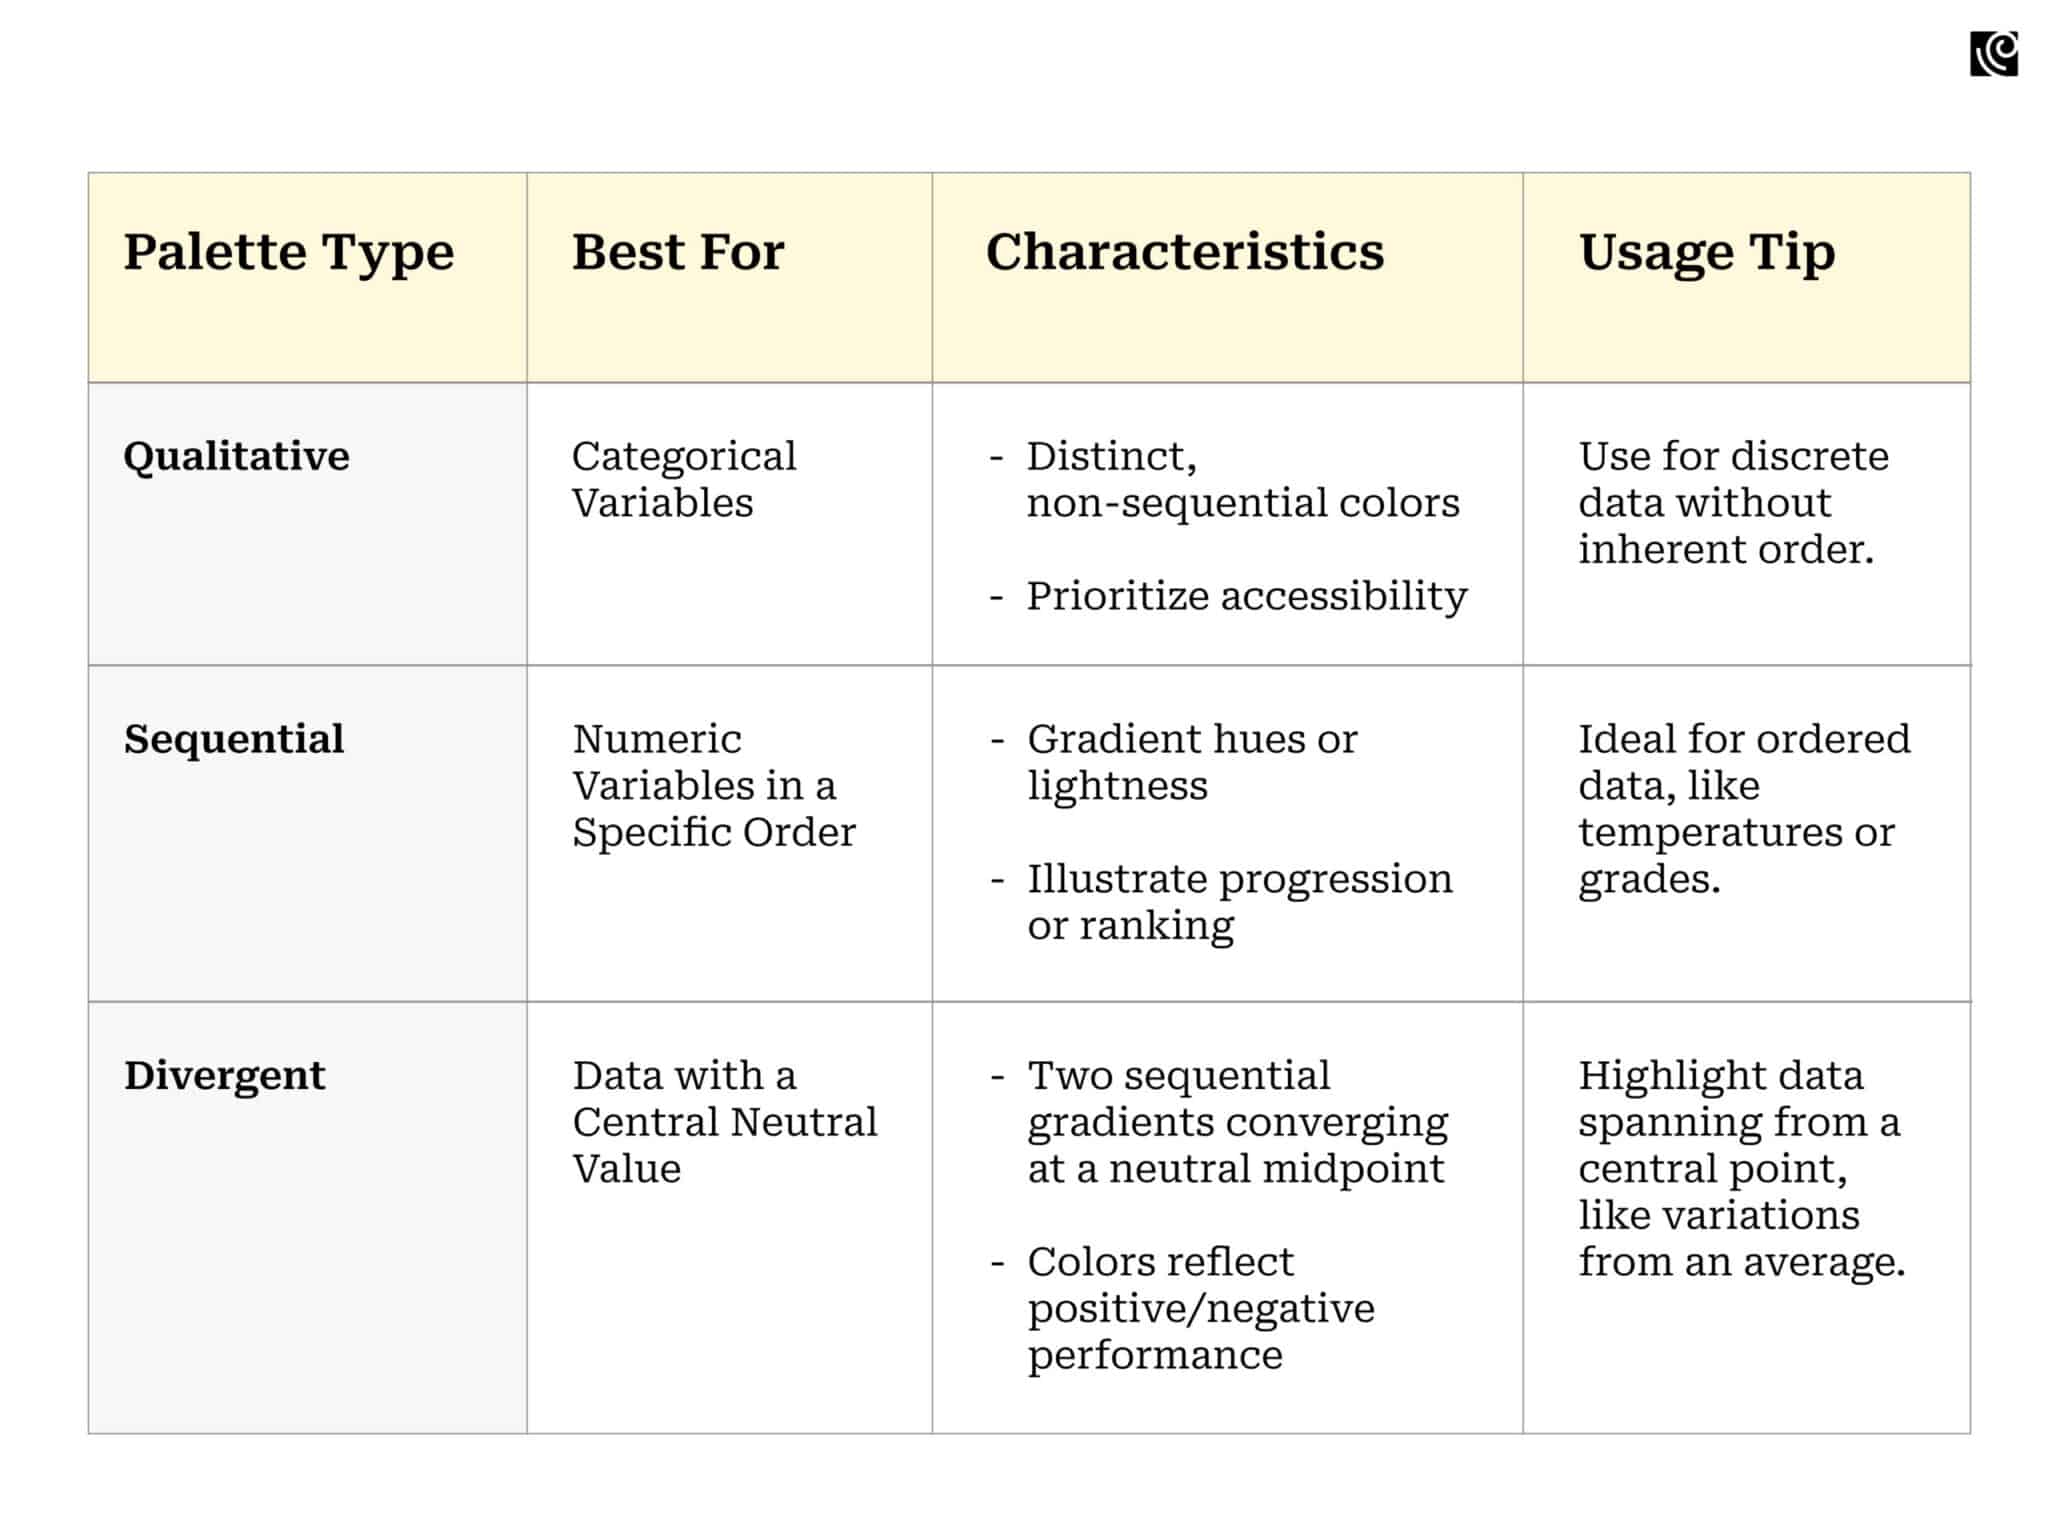
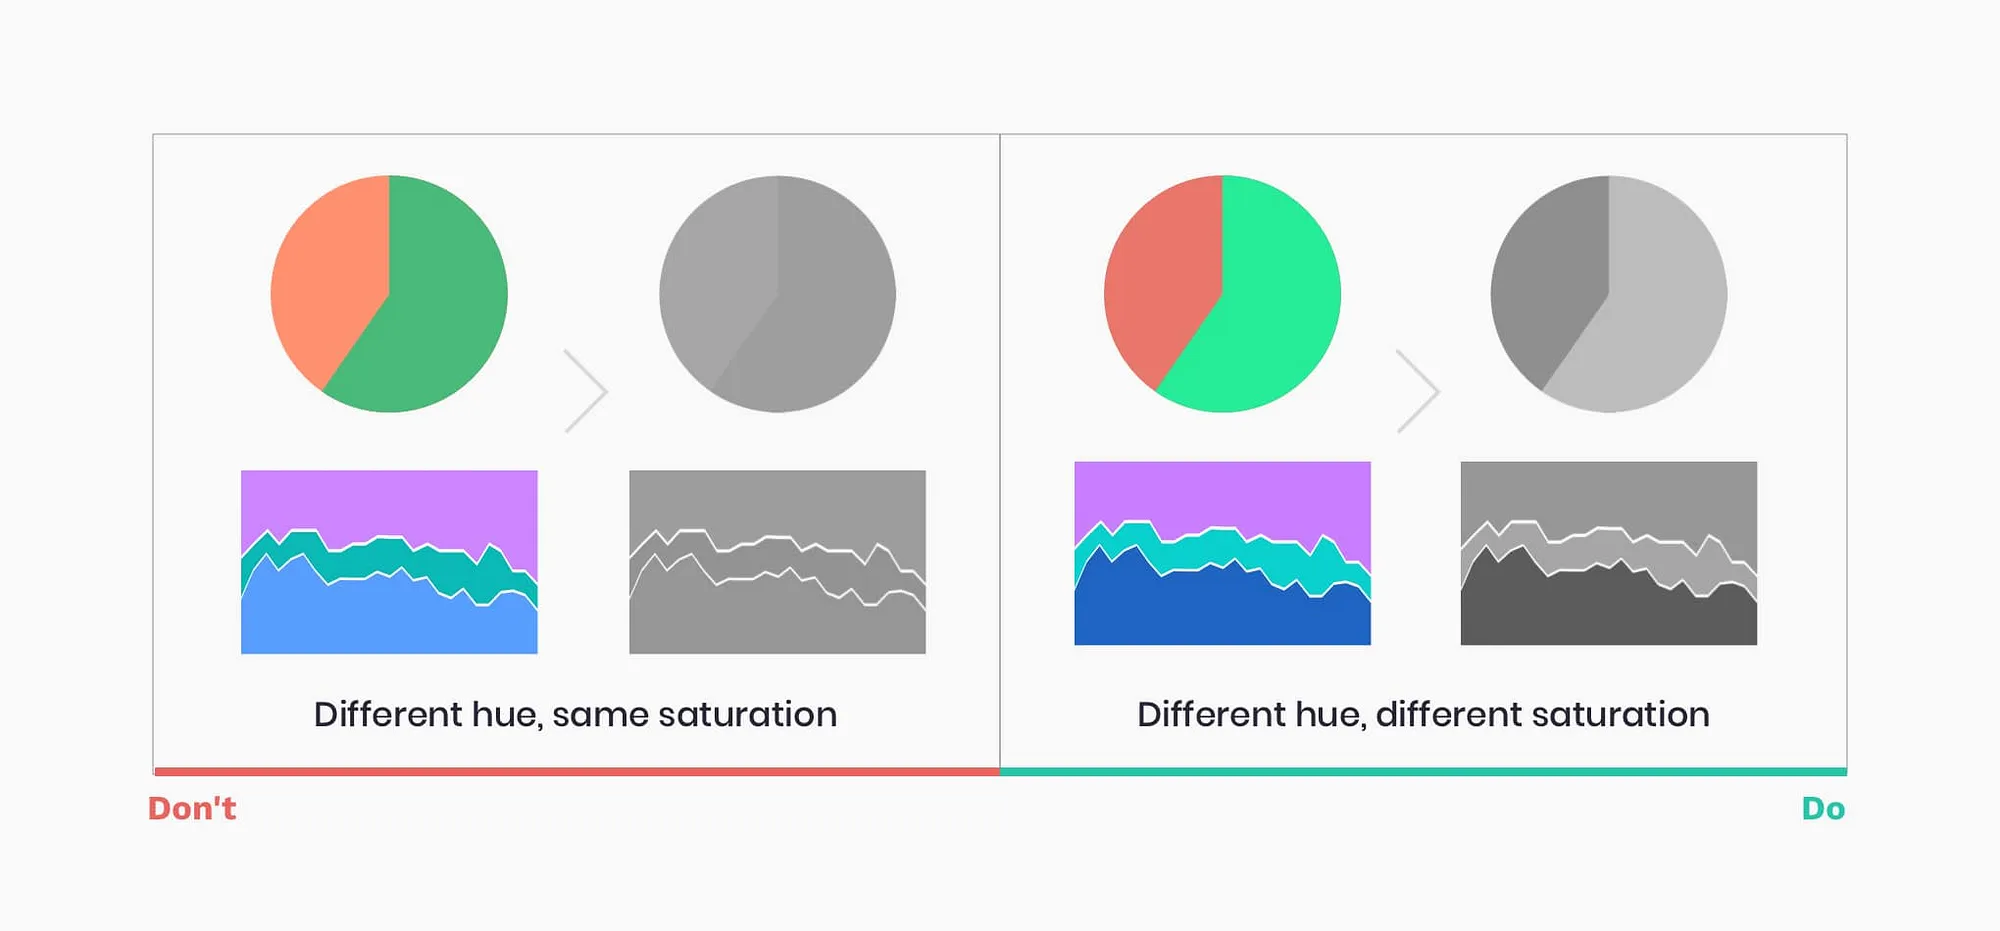
Apply color strategically such that it matches the nature of your data
Utilizing intuitive color palettes that offer good contrast enhances clarity and ensures that key data points stand out. Such attention to color not only improves the aesthetics of data visualization designs but also significantly boosts their usability and effectiveness.
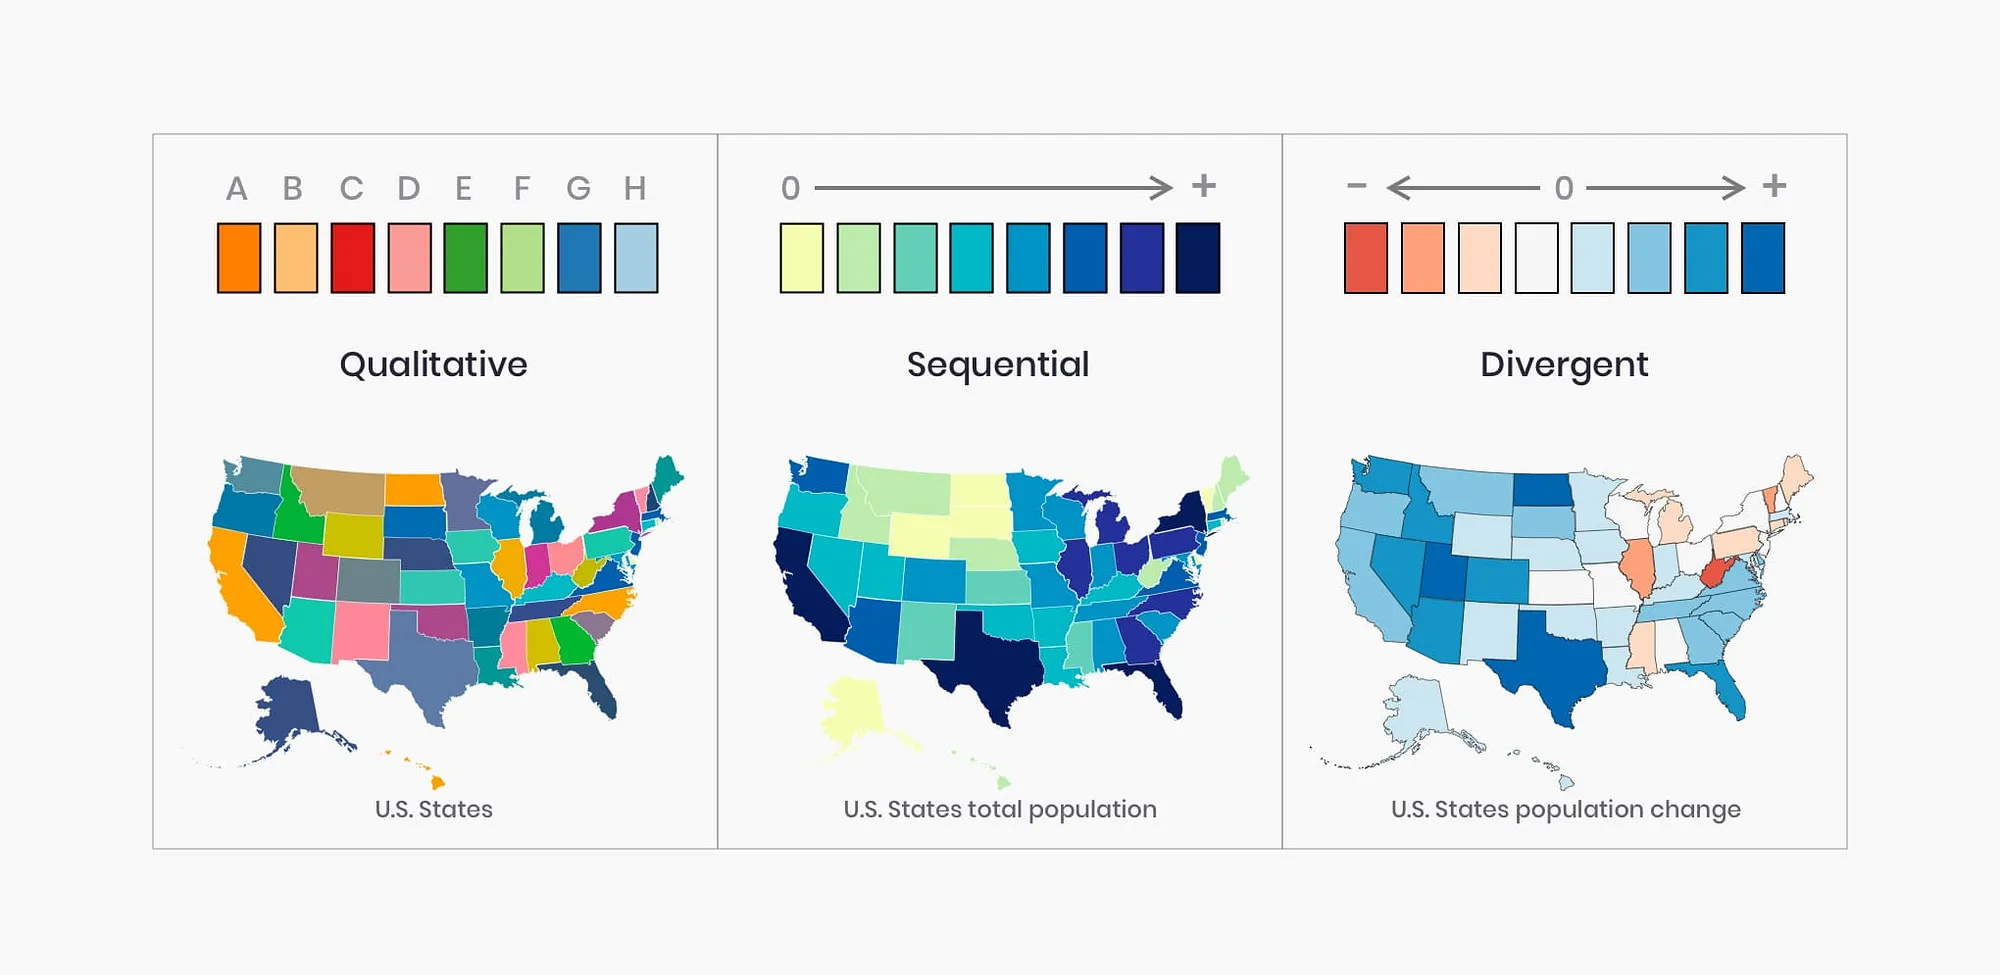
Here’s a quick overview of when to use which color palette:
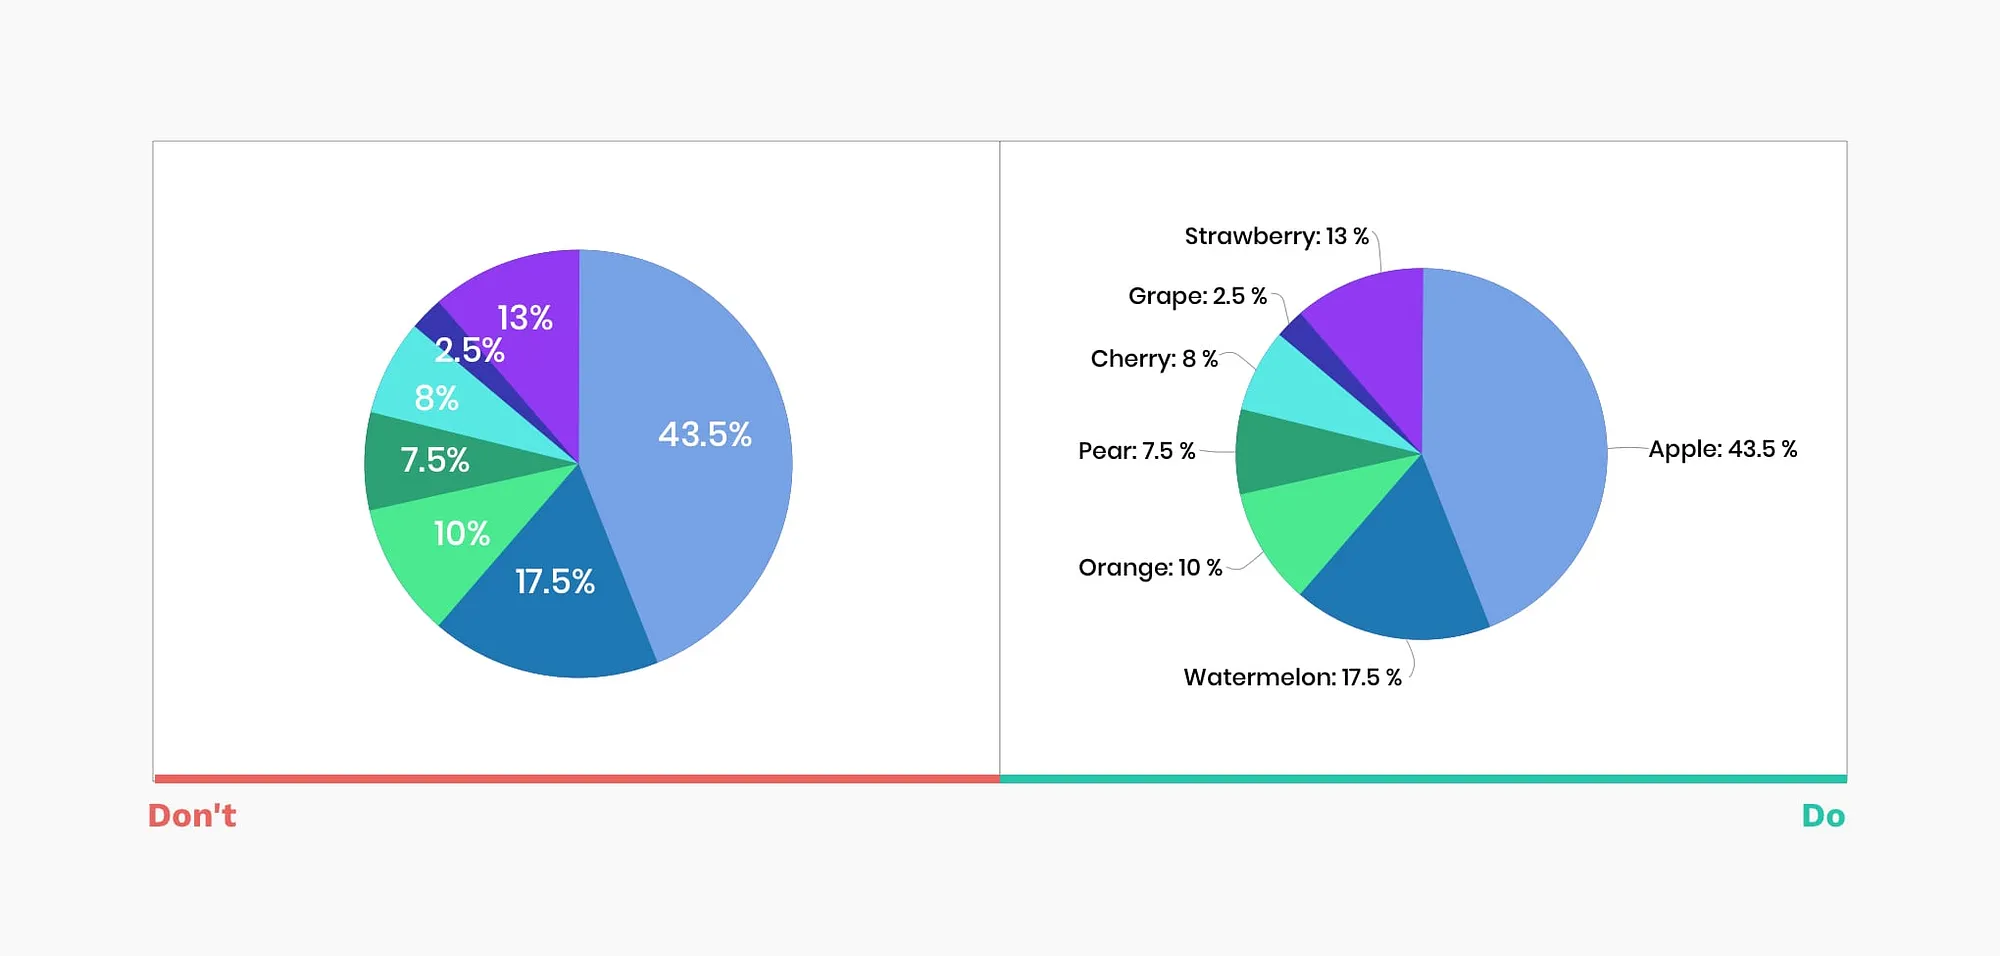
Direct Chart Labeling
A graph must be properly labeled to be understood, regardless of its aesthetic appeal. Direct labeling on the chart itself is extremely beneficial for viewers as it eliminates the need to cross-reference a legend, saving time and cognitive effort by allowing immediate identification of values and their related segments.
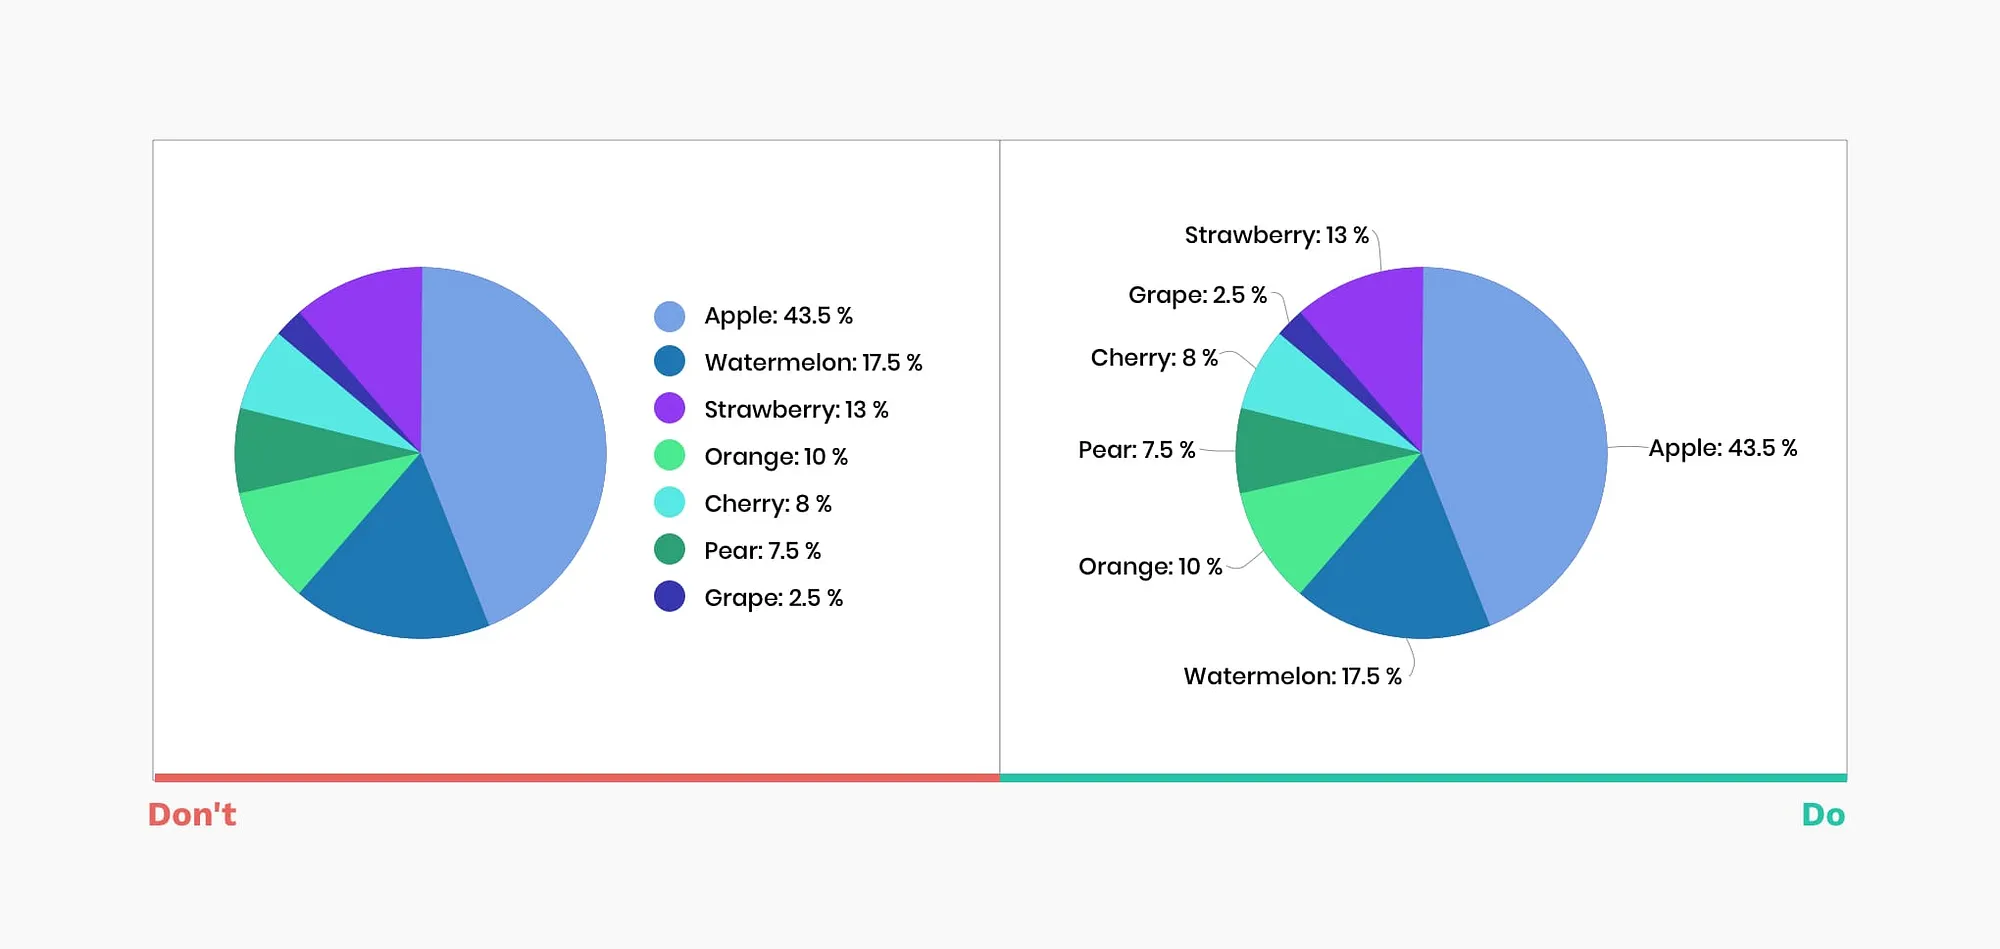
But Don’t label on top of slices
Placing value labels directly on thin slices can lead to legibility problems. To enhance clarity, it’s better to use black labels connected by clear lines to each segment, ensuring that all information is easily readable without cluttering the visual space.
Adding Depth with 3D Visualizations
3D visualizations have emerged as a powerful tool, yet their application demands discernment. These visualizations are most effective when they add a substantial layer of understanding to complex data sets, particularly in domains like engineering and scientific research.
Companies like Autodesk and Siemens, renowned for their engineering and design software, leverage 3D visualizations to provide deeper insights into architectural designs and mechanical components.
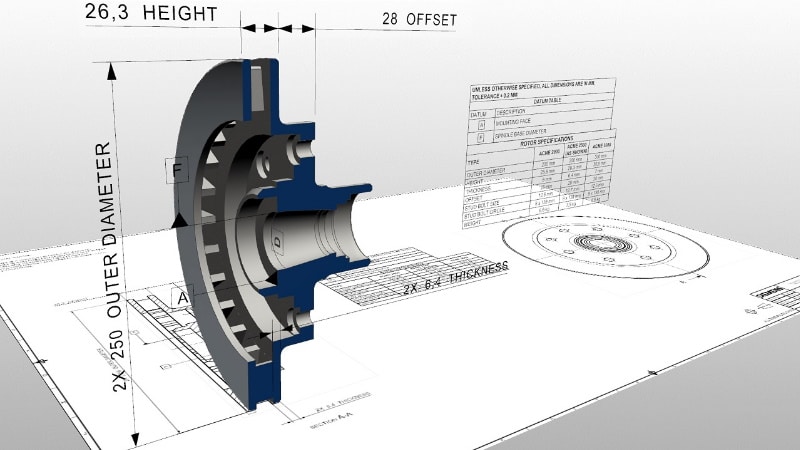
Source: plm.automation.siemens.com
However, it’s crucial to ensure that these visualizations are clear and accurate to prevent any potential misinterpretation.
Design for accessibility
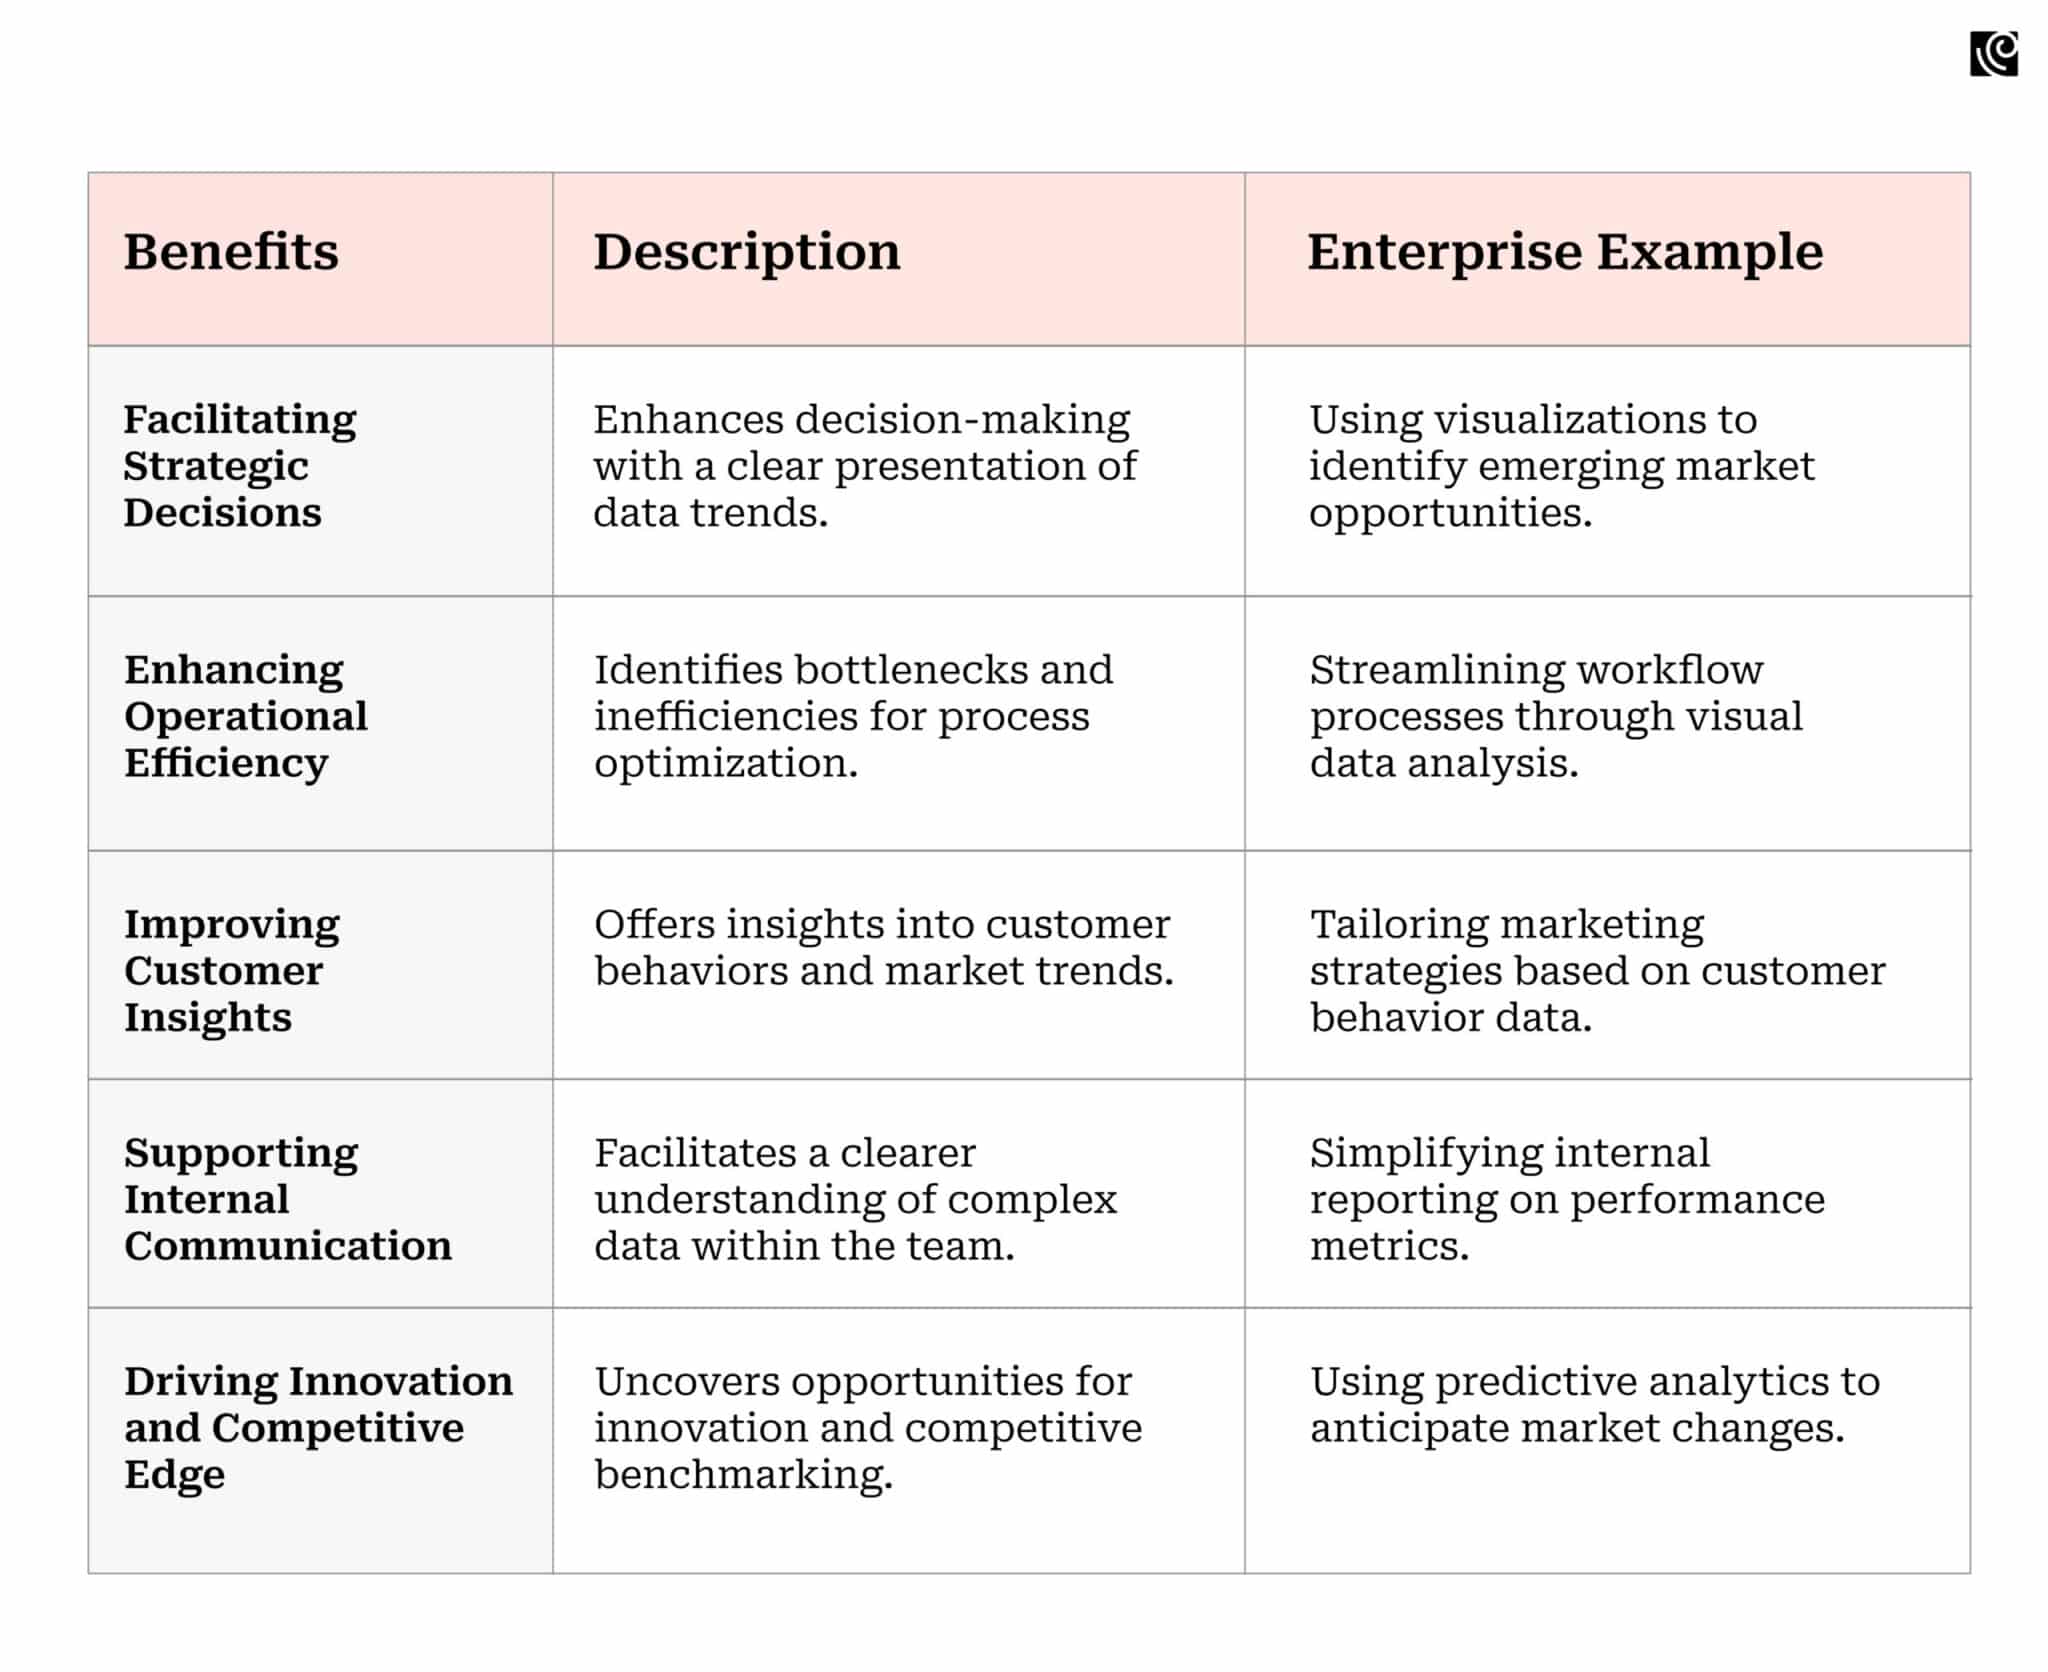
How Do Enterprises Benefit From Data Visualization
“The art of design is making data speak.”
For any enterprise, a visual approach aids in faster decision-making enhances understanding across diverse teams, and identifies trends and outliers that might go unnoticed in raw data. By presenting information graphically, enterprises can streamline communication, foster strategic thinking, and ultimately drive growth and innovation. Here are the multi-fold benefits of data visualization:
Final Thoughts
Incorporating best practices in enterprise data visualization is not just about deploying the right tools; it’s about how these tools are designed and utilized. For instance, interactive elements like tooltips and clickable items play a crucial role. The goal is to offer dashboards that allow in-depth data exploration without cluttering the initial view.
Responsive design is another critical aspect. It ensures your dashboards are responsive and adaptable to various devices, acknowledging that enterprise users access data on different platforms. Furthermore, user testing and feedback form the backbone of continuous improvement. Lastly, consistency in design is key for user familiarity. Maintaining a consistent design across your visualization offerings aids users in quickly adapting to and efficiently using their system. Each of these practices underlines the importance of a user-centered approach in enterprise data visualization, ensuring that the tools are not only powerful but also accessible and effective for users of varying expertise levels.


