


Tomer Sharon, Co-founder, and CXO at Anywell, in his insightful talk1 with Mind the Product, illuminated a common pitfall for product leaders: the obsession with granular UX insights. For example the number of clicks, session durations, etc. It becomes easy to lose sight of the overarching narrative when you go too microscopic.
Many teams, in their pursuit to quantify every nuance, end up overshadowed by intricate metrics, veering away from what truly matters.
How can you overcome this?
Shift the lens to high-level experience metrics.
Why? Because they provide clear, actionable insights integral for informed decision-making in the complex B2B landscape.
In this blog, we’re going to delve deep into why this shift is imperative, explore the key high-level metrics every tech product leader should be focusing on, and provide actionable insights for recalibrating your UX metrics strategy.
Tapping Into High-Level Experience Metrics: 6 Strategies For Product Leaders
UX metrics let you map the entire user journey, capturing the flow between touchpoints. Think of a B2B procurement platform. A procurement manager’s journey might start with a product search, followed by price comparisons, vendor assessments, and finally, the purchase. Now, imagine if 60% of users drop off at the vendor assessment phase. This signals a potential friction point in that segment of the journey.
By harnessing high-level experience metrics, leaders can visualize the entirety of the user journey, mapping out the valleys (drop-offs) and peaks (engagement highs). Here are some best practices for how product leaders can do this efficiently:
Aggregate Data >>> Siloed Data
Relying on a single question to gauge overall satisfaction is an oversimplification of complex user experiences. A holistic understanding emerges not from isolated data points but from a constellation of vital queries.
For example, imagine a B2B platform tailored for insurance providers. If the goal is to assess the comprehensive user experience of insurers using this platform, a singular question like “Rate your overall satisfaction with our platform on a scale of 1 to 10” is far too limited.
Instead, break down the overall user journey and identify the vital components integral to an insurer’s daily operations on the platform:
- Policy Management: How easy is it for insurers to manage policies on the platform?
- Claim Processing: How efficient and intuitive is the claim submission and processing workflow?
- Communication Tools: How effective are the built-in communication tools when liaising with clients or other stakeholders?
- Integration Capabilities: How seamless is the integration with other critical systems and software they use?
For each of these components, you can seek detailed feedback. For instance:
- On a scale of 1 to 10, how would you rate the ease of policy management on our platform?
- How efficient do you find the claim processing tools? (Rate from 1-10)
By aggregating these diverse responses, a comprehensive, unified satisfaction score can be birthed. This singular score, distilled from multifaceted inputs, provides a richer, more holistic view of user experience.
Take a cue from our UX metrics guide where we’ve mentioned some 50+ strategic UX metrics to help product leaders guage the effectiveness of their product’s UX.
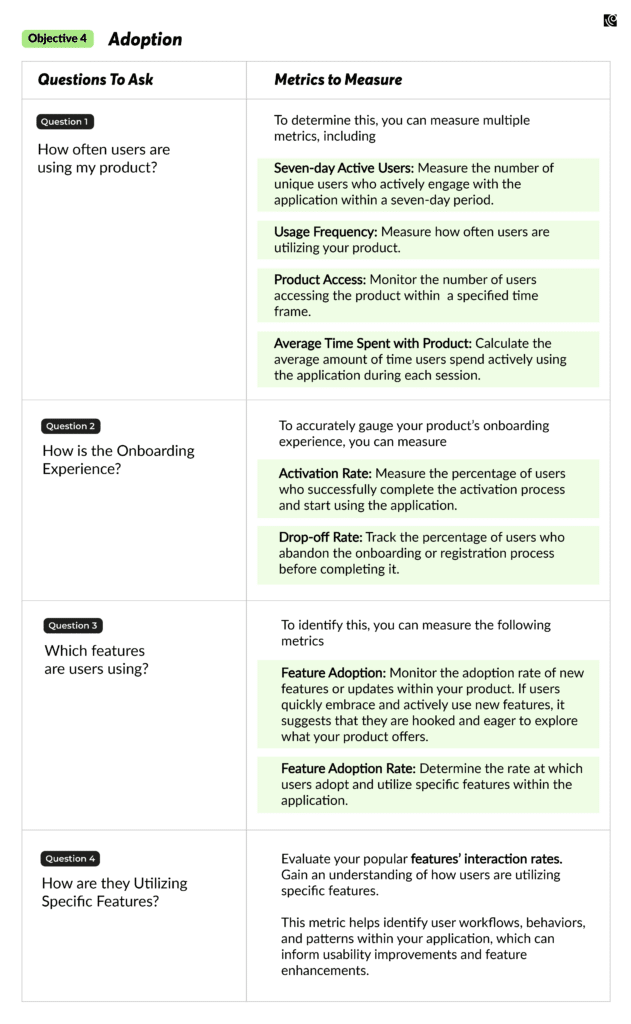
For instance, here we tried to get an idea of the overall adoption of a product. We’ve dissected all adoption-related factors into high-level questions. These questions are then enriched with relevant high-level metrics, each refining the insights further. While metric specifications can vary based on the system you’re analyzing, these metrics offer a robust framework for most B2B enterprise products.
And that’s just a glimpse into one facet of UX—adoption. To uncover more dimensions, simply download our guide.
By downloading our UX Metrics Guide, you’ll gain access to:
- A diverse range of metrics tailored to different aspects of user experience.
- Insights into how these metrics collectively paint a vivid picture of your product’s success.
- Strategies to align your measurement approach with high-level experience metrics, ensuring a holistic perspective.
Clicks Don’t Tell the Whole Story
Click-through and conversion rates are often hailed as the primary indicators of user interaction. Yet these metrics might not fully capture genuine engagement or user satisfaction, especially for digital B2B products.
Consider an analytics platform—A user rapidly clicking across multiple features might be struggling to find the right data visualization, rather than actively engaging. The new era of user metrics demands a shift from mere click counts to a nuanced analysis of interaction quality. You must transition towards engagement-centric metrics, such as engagement duration, scroll depth, and interaction intricacy.
Prioritize Behavior Over Opinion
There’s an inherent flaw in heavy banking on opinions: they are mercurial. While they offer a snapshot of a user’s feelings at a specific moment, they often fail to paint the full picture. Opinions, particularly in the form of satisfaction surveys, are riddled with biases. They’re influenced by a gamut of variables, from the respondent’s current mood to recent events.
For a genuine understanding of user experience, it’s pivotal to lean on behavioral metrics rather than these often misleading opinions.
Take Tomer Sharon’s engagement with the MTP audience, for instance. When he prompted attendees to rate the ongoing conference, he highlighted that their responses could be swayed by myriad factors – whether it was the room temperature, the current time of day, or their prior experiences with such events. An opinion taken at 9 AM might differ wildly from one taken post-lunch.
“Satisfaction is extremely biased and there are other, more telling, metrics that show the actual behavior.”
Timer Sharon, Co-founder, and CXO at workplace experience platform Anywell.
In contrast to this example, consider Google’s Heart framework. While ‘Happiness’ centers around opinion, it’s the other three metrics—Engagement, Adoption, and Retention—that truly shine. They provide empirical evidence of user behavior, rather than mere sentiment. By anchoring on these behavioral metrics, Google’s framework excels where many others fall short.
- Behavioral metrics provide tangible, actionable data.
- Engagement metrics can reveal how often users interact with a product and the depth of their interaction.
Adoption rates highlight how many users start using a product, signaling its initial appeal. Retention rates, on the other hand, provide insights into long-term product value and user loyalty. By focusing on these behavioral aspects, product leaders can pinpoint areas of improvement, identify user pain points, and design strategies to enhance overall user satisfaction.
Qualitative User-Centric Engagement Metrics: Look Beyond The Obvious
In the B2B landscapes, it’s imperative to note that genuine engagement isn’t merely task-driven. It’s about the quality, depth, and richness of interactions that users have with the product. Many product leaders fall into the trap of equating engagement with task completion.
Consider this: Two users might complete a task on your platform. However, one does it efficiently, using multiple features and tools, while the other struggles, facing friction and hurdles. The end result, task completion, might be the same, but the journey? Worlds apart. And it’s this journey that holds the treasure trove of insights.
- Metrics like active usage duration provide insights into sustained attention, hinting at user immersion and interest.
- Feature adoption rates can reveal the most (and least) valued tools, nudging teams toward areas that demand innovation or improvement.
- Task completion times can be instrumental in understanding efficiency, bottlenecks, and user flow.
By holistically interpreting the user-centric engagement metrics relevant to your products, you can unearth the nuanced moments where users find value or face friction. With these insights in hand, iterative enhancements can be more targeted, impactful, and aligned with genuine user needs and desires.
Don’t Forget Measuring the Emotional Resonance
Traditional metrics, for all their worth, sometimes miss the emotional undertones. That’s where high-level experience metrics step in.
For instance, consider project management software. While it might score high on efficiency and feature set, users might find its interface cold or intimidating. Through sentiment analysis and feedback sentiment scores, product leaders may identify such emotional barriers.
Discovering that a significant portion of users feel overwhelmed or stressed while using the tool can be as crucial as knowing how many tasks they complete. Addressing these emotional pain points—perhaps by simplifying the interface or adding supportive onboarding—can make users not only perform better but also feel better. By integrating both functionality and emotional resonance, products achieve a harmony that truly captivates its users.
Value Long-Term Outcomes Over Short-Term Surges
For B2B product leaders, it’s tempting to chase immediate results. Short-term metrics, like a sudden surge in user activity after a new feature, can be gratifying but might not last. These are often surface-level indicators and can be deceptive.
On the other hand, long-term metrics focus on sustained growth. They measure how many users remain engaged over time and the true value they get from the product. These metrics offer insights into the product’s lasting impact.
Take Tony Ulwick’s Jobs-to-be-Done framework. It’s centered on the idea that users measure success based on outcomes—how effectively a product lets them achieve a specific goal or “job.” An outcome, in this sense, isn’t about just using a feature, but about realizing its value. For a fitness-tracking app, the outcome isn’t just logging a workout but how it helps users improve their fitness over time.
This distinction becomes crucial when balancing business goals with user satisfaction. While short-term metrics might signal a successful product launch or a quarterly sales target met, they might miss the mark on long-term engagement.
Conclusion
As product leaders, ensuring that you’re on the right path requires metrics that speak directly to your objectives. High-level experience metrics provide a clear snapshot, helping teams align, iterate, and improve. They bridge the gap between granular data and actionable insights. By embracing this approach, we’re not just crunching numbers, but truly understanding and enhancing the user journey. Remember, it’s not just about quantity, but quality and relevance of the data that drives success in the B2B landscape.


