Product managers aim to create products that fulfill business goals alongside building user satisfaction.
But how can one achieve this aim?
It’s simple. PMs can achieve this by measuring the usability of the product.
In short, through usability metrics or data.
Data is a great place to start addressing roadblocks between your products and their users. Meeting users’ expectations is an easy call to make when your data (or UX design metrics) nudges you in the right direction. Usability metrics are a goldmine. It is not only valuable for your development strategy but for sales, marketing, and evolving support strategy.
Today, we will talk about some simple UX design metrics to help you gain a footing in measuring the impact of your UX exercises. But first, let’s dig a little deeper into the meaning of UX design KPIs and why data-backed UX is the need of the hour.
Importance of Data-Backed UX
Building a product without data is an alarmingly dangerous practice in product management. Businesses might spend a lot of resources and never get to the desired outcome.
“Data is the oil of the 21st century, and analytics is the combustion engine.”
– Peter Sondergaard from Gartner Research
Therefore, product managers who are more “data-driven” than “gut-driven” can curate winning strategies for their products.
Data talks to those who’re willing to listen. If you look at data correctly, you’ll be able to derive worthy conclusions about what works best for the product. Eventually, data helps you build products that users love.
However, gathering data and using it are two different things. Using the KPIs and metrics for UX to define the course of your product development is utterly necessary.
What Are UX Design KPIs?
Product managers and designers need a set of design KPIs and metrics for UX to communicate design productivity. UX design KPIs measure the performance of a product to find out how well its users are receiving it. UX design metrics highlight the triumphs and shortcomings of a product and convert aspects like user behavior and experience to numerical scores that generate actionable design insights.
These numerical insights allow product managers to analyze the product’s value and accessibility and improve it to boost overall user experience. However, product managers must know how business KPIs differ from design KPIs. They need to curate strategies that deploy the right KPI set for product evaluation.
Let’s look at 5 UX design system metrics that product managers should be well versed in to build great products.
5 UX Design Metrics That Matter
An institutional focus on experience design and design thinking helps create technology that enhances user productivity. It has a direct impact on business revenue. Product managers formulate the product roadmap and are in charge of the product’s design, development, and launch. PMs hold the responsibility of ensuring optimal product performance. Familiarizing with product success metrics for UX is hence the necessary first step.
Task accomplishment rate
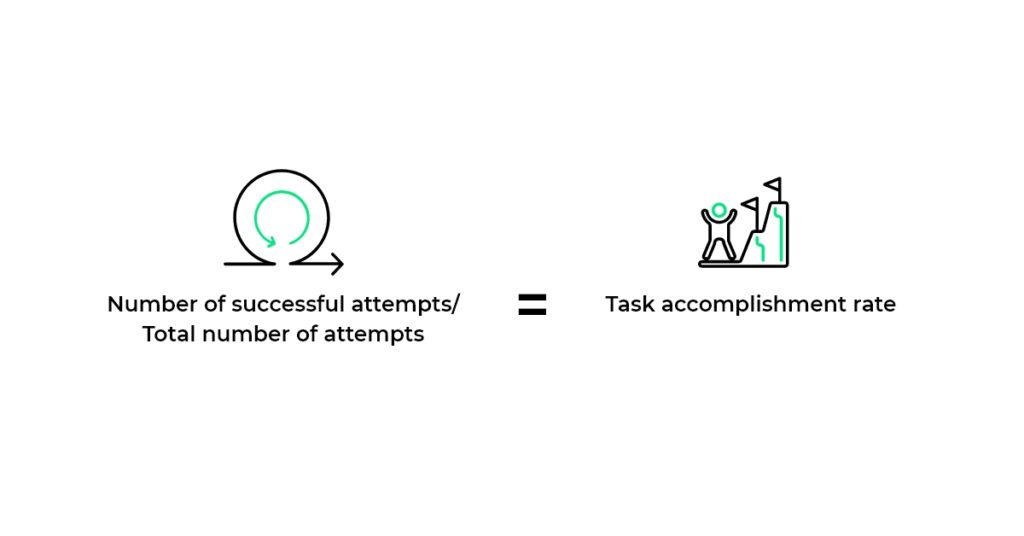
Task accomplishment or task success rate is the most easily understood among UX design system metrics. It calculates the percentage of participants that accomplish a set task and helps designers identify user experience issues, particularly for tasks defined with a clear beginning and end point. To measure task success rates accurately, they need to align with clearly defined goals.
The formula applied to measure the task accomplishment rate is –

Some tasks you can incorporate into the UX design metrics include onboarding processes, resolving a complaint ticket, creating the right product bundle for customers, etc.
Keep in mind this crucial aspect while calculating the success rate:
The task accomplishment rate won’t reveal how well the users perform tasks or why they fail them. Instead, it allows UX designers to see where users are having trouble, such as at confusing junctions, when too much effort is required, or when the next step isn’t clear. A low task accomplishment rate indicates the need to redesign that particular aspect.
Task completion time

Task completion differs from task success rate. It measures the time taken for the user to complete a task. Different users tend to have multiple completion times for the same task. It depends on a combination of human and technological factors. The most accepted convention for this metric is that:
“The lesser time a user spends on a task, the better the UX.”
There are several ways to determine the task completion rate. It depends on the evaluation method used and the type of project. Some examples include –
- Average completion rate: It accounts for the users who complete the task.
- Mean time to failure rate: It measures the average amount of time taken by the users before giving up the task.
- Average time on task rate: This refers to the average time users spend on a task.
Besides, you can find out how users use the products by measuring metrics for UX such as
- The average length of task completed on the first attempt.
- The average length of the task completed on repeat attempts.
These are crucial metrics for enterprise systems where users complete repetitive tasks. The task completion time metric plays a crucial role in determining the usability of a product.
Feature usage rate

The feature usage rate metrics help gauge the long-term utility of a product. It helps measure user adoption by calculating the percentage of users who perform a desired action. The ‘desired action’ in this case may refer to anything. It could be seeking a transcript translation in an online consultation or seeking patient history in an EHR.
To accurately measure the feature usage rate of a product, you must define what actions and activity it would constitute of. For example, say the EHR has a feature that helps providers translate the transcript of a patient. Here the feature usage rate will reveal if users can use it and if it is a necessary feature to have.
By studying the usage of the designated actions, UX designers can determine the usability of a particular feature. Based on this data, they can further take action on the product features.
Error Rate
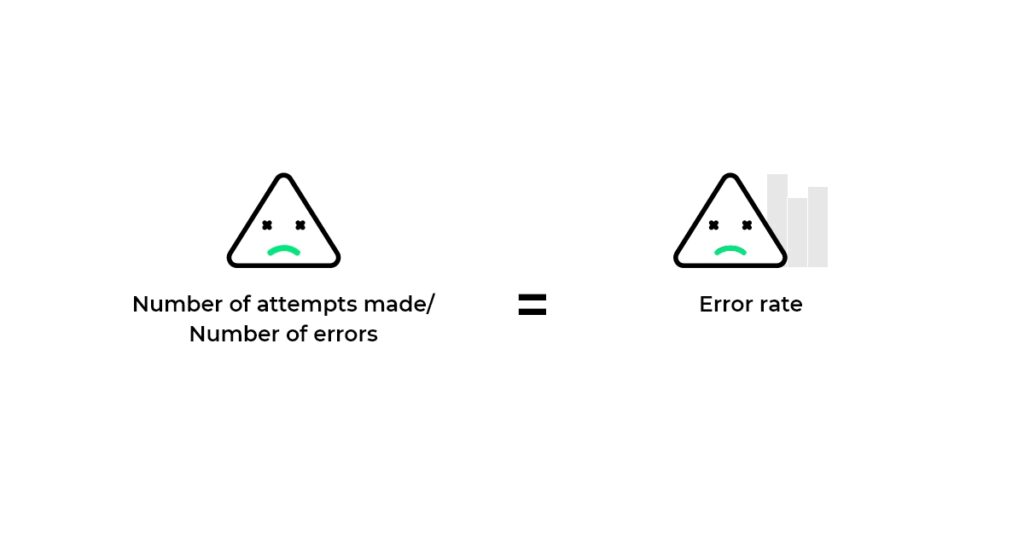
The error rate is a crucial part of UX design metrics. It calculates the percentage of errors made by users. The formula to calculate it is –

A high error is a clear sign of usability issues. Tracking the error rate is crucial as it helps answer questions such as:
- Is there a need to provide a clear explanation for the task?
- Is the interface too complex?
- Are there ways to simplify, restrict, or prevent common errors from occurring?
Errors are a severe barrier to product success. And so, this metric is one of the most crucial ones on the list. It reveals the chinks in the product’s armor and helps make the right design decisions.
For instance, frequent mistakes in a form with many fields reveal that the fields aren’t self-explanatory. Designers can hence take the corrective action needed to make it more intuitive.
Heuristic report

Heuristics is a part of UX analytics that may not seem like a metric. But it is a crucial step to ensure that your product rates high on usability. Heuristics rely on predefined and tested usability principles, standards, and conventions.
Some criteria applied in a heuristic evaluation include –
- Checking if users are in control – finding out if your users understand the system and can rectify erroneous actions.
- Make use of real-world jargon and ensure that users can understand the content.
- Ensure that you’re consistent with words, icons, layouts, etc.
Heuristics evaluators determine a product’s usability by going through a checklist to find flaws in the design. These flaws are then rated as per their severity and impact on the user experience so that designers can rectify them.
Final Thoughts
User experience permeates all aspects of the business. Hence product managers must be aware of crucial UX metrics. PMs must understand all there is to know about providing the best experiences to their users. It was just a roundup of the beginner-level metrics relating to software products. There’s more to it – how do you check if your user experience is working? Keeping the UX in check is a good practice to ensure that your product offers the right experiences to its users. We hope this introduction to UX metrics has been helpful, do let us know in the comments below.


