


The 20th century took enough leaps to address issues of complexity and speed. The introduction of cloud-based systems further enhanced the efficiency of business processes.
But with time and the use of the internet, the surge in data generated by these applications gave rise to data-driven decision-making, termed Business Intelligence (BI). Now, business managers can make decisions based on historical data and the speedy processing capabilities of these applications.
The term ‘business intelligence’ has become common in boardroom discussions lately, but it dates back to the 1860s. Howard Dresner first proposed it in 1989 as an umbrella phrase for applying data analysis techniques to support business decision-making processes. Since then, business intelligence has grown strong in terms of data processing and data analysis. Companies started to measure their performance by comparing last year’s growth to this year’s or establishing the cost of acquiring new customers.
Business Intelligence User Experience
Business intelligence defines the technical infrastructure used by companies to merge and analyze data from different sources to create a coherent strategy. BI varies greatly from improving the sales funnel to streamlining operations or enhancing its user experience (UX).
You might be aware of the ‘If only’ Syndrome of business intelligence. If only there I could find the data more quickly. If only I could have a holistic view of my reports 24/7. If only I could see the business intelligence dashboard on my mobile rather than having to open my laptop.
All the above elements stem from a single problem — the business intelligence application’s user experience.
Yes.
It’s all about the UX.
But the days of ‘if only’ are over. In 2022, your organization’s business intelligence can and must be a powerful yet user-friendly application to help you make informed business decisions. This article explores exactly that. Read ahead to find more on UX and user interface in business intelligence.

What Does Data (Business Intelligence) Have To Do With the UX Business
Ease of use and ultimate user satisfaction is something that every UX design business project aims to achieve. Data can help you attract and engage users, streamline their journey, sell more, and ultimately make customers feel important and like they matter.
Understand the synergies that arise from combining multiple data sources. Data-backed findings can reveal possible bottlenecks in your applications, be it a more impactful call to action, more straightforward navigation, or more. A BI-integrated solution can speed up data collection, aggregation, and cross-checking.
5 KPIs To Consider While Choosing A Business Intelligence Application
Redesigns are costly and could make users steer away from your organization. 70% of projects fail due to the lack of user acceptance. Therefore, you must ensure you get it right the first time.
Besides, changing the look and feel of your application after launch can frustrate users since they might not quickly adapt to new layouts and styles. To avoid that, make sure you get it right from the beginning. Here are five KPIs you must consider while choosing a business intelligence application.
Faster Action in Discovery
Delays in data analytics can be because of relying too much on reporting teams. Users, however, look forward to finding solutions to their problems in real-time. Business intelligence applications must enable users to discover answers faster than any other source. To ensure this, you can use a tailored, flexible, and ready solution with slight modifications to save time, eliminate duplication, and increase the accessibility of content as required.
Easy Interaction with Data Reports
Basic users and power users warrant separate guidelines. Basic users can interact with reports through nominal filters. They can access guided analytics or emphasize data insights. Power users, however, should be able to create, modify, and manipulate new business logic or calculation using advanced tool features.
Threat Control
Prevention of security breaches and privacy compliance processes must be in place within a Business intelligence tool. Security administration must delegate to a particular group of users with each department, along with an auditing trail to track the usage of the content.
User Interface
The application must carry a user-friendly interface that ticks all the boxes of requirements. Mobile applications are expected to offer responsive touch interfaces. All the features of business intelligence must support the corporate environment.
Creating a user-friendly UI is paramount to increasing adoption rates and usage. The user interface should also be customizable to meet corporate styles, themes, and most importantly, accessibility requirements.
Scalability
The platform must scale up and deliver optimal performance to match the growth of the data volume and number of users. Large enterprises must consider the scale-out option of self-service business intelligence.
But wait, achieving the KPIs are also important, aren’t they?
The bottom line is that business decisions are still taken by the key stakeholders or users. Therefore, the business intelligence application must be user-centric. One of the greatest KPIs any business intelligence application can have is to help it make better decisions. For a business intelligence application to achieve it, all it needs is a perfect segue to UX.
What is UX?
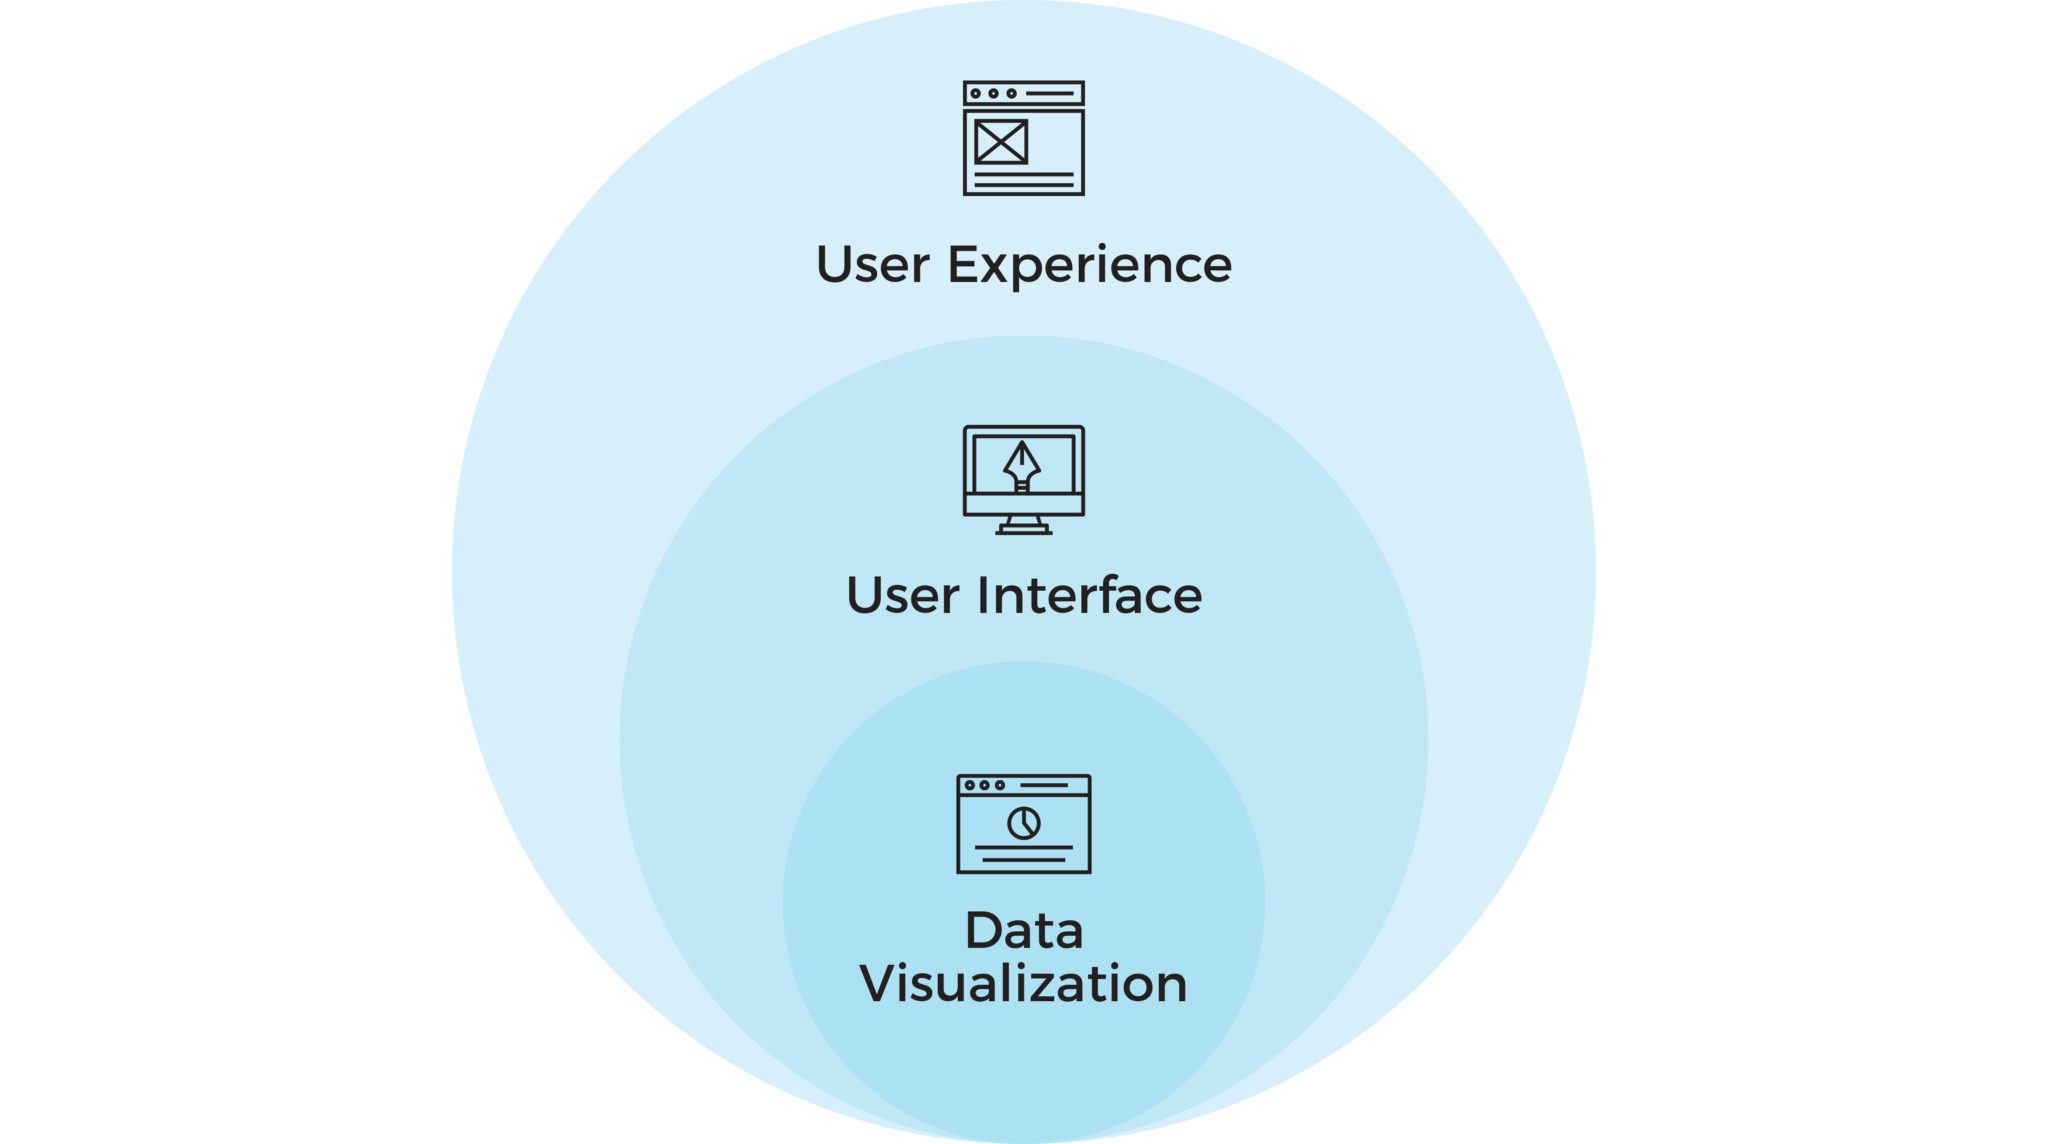
For any UI UX design business project, User Experience governs how every business intelligence project is built. It’s a methodology and a framework for discovering users’ needs and crafting business intelligence solutions that meet the said needs. UX informs the essential elements of UI and data visualization.
Where UI lies outside UX, it pertains to discretionary visual elements, such as color schemes, font choices, etc. The data visualization lives fully inside the UI. It is a selection of charts in a logical order called for in a use case, journey map, or persona — derived from the upfront UX research work.
How UX Helps Business Intelligence
User research focuses on understanding user behaviors, needs, and motivations through observation techniques and task analysis. User research is crucial for business intelligence applications since users tend to vary.
User research involves conducting interviews with the CEO, chief analyst, and all the stakeholders of the business intelligence application to understand their goals.
Listed below are the key elements of user research:
Personal Interviews
Personal interviews with the stakeholders help in establishing the goals of any business intelligence application. They are a fast and easy way to understand the reactions and expectations of the users. These interviews help in identifying information to help make decisions faster.
Data Discovery
Any business intelligence application’s primary role is to analyze data and present it crisply. Data discovery helps to understand the pattern in which you can consistently represent the data.
Use cases
Use cases describe a way to use a system. However, one of the greatest benefits of use case modeling is that it describes all the things that might go wrong. Identifying exceptions to a successful scenario early in the design saves time by finding subtle requirements. Covering all the use cases is crucial in any application, but business intelligence applications particularly need special care for the user to dive into data as deeply as possible.
Journey Mapping
Journey maps are a description of the users’ experience or their subjective reactions or feelings when using a product or service. Journey mapping reveals insights into the target users’ feelings, ideas, and behavior at a particular time. These details aid designers define the evolution process and find users’ pain points. In the long term, journey mapping helps designers establish confidence-based relationships with users based on their perspectives.
Business Objective
Clear objectives provide a well-understood definition to owners and employees. Measurable objectives ensure that business owners can review and confirm that you achieve them in the best way possible. UX research helps ensure that the business objectives are kept in mind while designing any business intelligence application.
Closing Thought
In today’s enterprise world, satisfying user needs has become paramount, and business intelligence applications are no exception. A satisfied user is a reward to any organization, and including UX in any project can get us there.
Focusing on UX serves two connected goals:
- It elevates the business to become user-centric.
- It serves the user a streamlined journey.
Using data in this process is the only reasonable choice. You must use it at every step, from defining your goals, comparing your business to competitors, knowing what users want, and making the interface more eye-catching.
Hence, ensure that your business intelligence infrastructure creates a place to gather all the data. Make sure that you always keep analyzing new data. If doing it in real time is not feasible, try to use the most recent data in line with the ongoing trends. It will translate into better engagement and increased ROI.
[sp_easyaccordion id=”14816″]


